Analysis Program - NoiseStudio
Noise Studio is a post-processing program that can perform sound analyses in compliance with current Italian and European Community norms. The analysis functions are grouped in software modules that can be enabled using a licence.
The analysis environment gives several display functions (as a table or graphically) of the different sound measurements and processed results. All graphs and tables can be exported to other applications in the Windows® environment. The analysed data and results can usually be stored as projects, together with other documents, so as to allow future checks and analyses.
You can process the data downloaded from the sound level meter memory using the NoiseStudio program, and the data captured directly by the PC's memory using the Monitor program.
Railways Traffic - Software Module Manual
Introduction
The Railways Traffic module is used to capture and process the performed sound measurements for the analysis of noise related to railways traffic.
The data are transferred from the sound level meter memory to the PC using the NoiseStudio program. Here, they can be processed in compliance with the Italian and European Community norms concerning traffic noise.
If not otherwise specified, this manual will refer to the software module using the term “program”.
The program allows input of a sound trace, automatic detection of events, parameter calculation for each event (duration, SEL, LAeq, LF max), and calculation of descriptors: Leq, day TR - Leq, evening TR - Leq, night TR - Leq, global TR.
At the end of processing, you can transfer the data into an Excel® spreadsheet, or use a Word Document® file provided with pictures of the analyzed environments.
All files can be grouped, for convenience, into a single Project.
NoiseStudio
Start up
To launch the program, double click on the
NoiseStudio ![]() icon using the left button
of the mouse, or click Start and select All Programs
>> Delta Ohm >> NoiseStudio.
icon using the left button
of the mouse, or click Start and select All Programs
>> Delta Ohm >> NoiseStudio.
Demo Mode
This program, once started for the first time, asks for an activation
hardware key, otherwise it works under Demo condition.
Under this condition all the software functions are enabled but you
can only use the exmples files as input data, which are available in
the CDRom NoiseStudio - Sample Files (D:\Esempi\Ferroviario\).
In order to get the hardware key for the module activation, please contact your distributor (HERE below are the details).
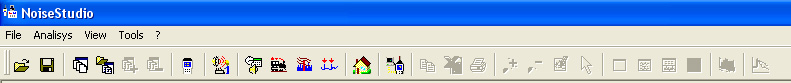
The main window will open with the following control panel: Main Menu and Toolbar.
Program Execution
The Railways Traffic module processing phases are essentially three:
In order to assess the railways traffic noise, according to the decree of 16/03/98, you need to memorize the profile of the A weighted sound level with FAST time constant. The contribution of each train is assessed by calculating the SEL (Sound Exposure Level) of the passages.
In order to obtain this result, you can choose several measurement configurations according to the instrumentation used:
- HD2110 and HD2010 with data logging function:
- Recording of the LAF at 1/8 sec profile for 24 hours (you need a memory bank of 4M)
- HD2110 with sound events capture function:
- Recording of the LAF at 1/8 sec profile during the event and LAeq measurement for the entire 24 hour period with a lower time resolution
- Monitor Program:
- Recording of the LAF at 1/8 sec profile for 24 hours (you need the data logging function for the HD2010)
When capturing the information using the Monitor software you can record the audio linked to the various passages.
NOTE: To correctly perform the measurements, please see the relevant norms:
-
Italian norms (D.Lgs. 08/2005)
-
European Community norms (Dir 2002/49/CE)
Measurement procedure for the HD2010 and HD2110 sound level meters
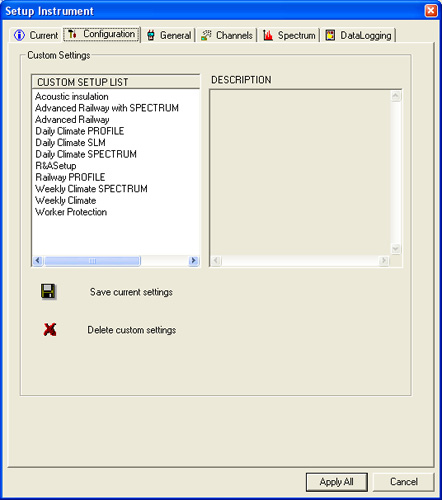
To set the correct sound level meter measurement parameters you only need to load the "Railways Traffic" configuration file (or "Advanced Railways Traffic" for the sound level meter with the Advanced Analyzer option) using the NoiseStudio program. After connecting the sound level meter, open the "Sound Level Meter >> Instrument Setup" menu and choose "Load Settings" in the "Options" screen.
The measurement parameters will be the following: (Valid for HD2010 and HD2110)
- Measurement range with 140 dB bottom scale
- Integration time equal to 24 hours
- Single integration
- Measurement parameters of the profile screen: LFmx dBA at 1/8s
- Recording
Instead of recording a profile for a period of 24 hours, you can perform multiple recordings, each for an integration time shorter than 24 hours, and use the program to rebuild the full sound trace.
Start the recording
Download data from sound level meter using the NoiseStudio program.
Now, all information on the sound levels related to railways traffic during 24 hours are on the PC.
Project Creation
To perform the "Railways Traffic" analysis using NoiseStudio, first you need to create a Project, that is, a working environment.
|
|
To start the "Railways Traffic" analysis with NoiseStudio, select Analyse >> Acoustic pollution >> Railway/Airport Traffic in the main menu, or click on the key shown in the figure, which is located in the Toolbar. |
The program will ask to create a project or to open an existing project.
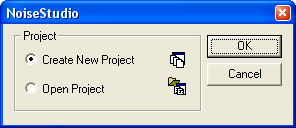
To create a new project select Create New Project and confirm. The project name and position selection window will open.
Once the project name is saved, the file "Project Name.nsw" will be created into the new "Project Name" folder for the Project itself.
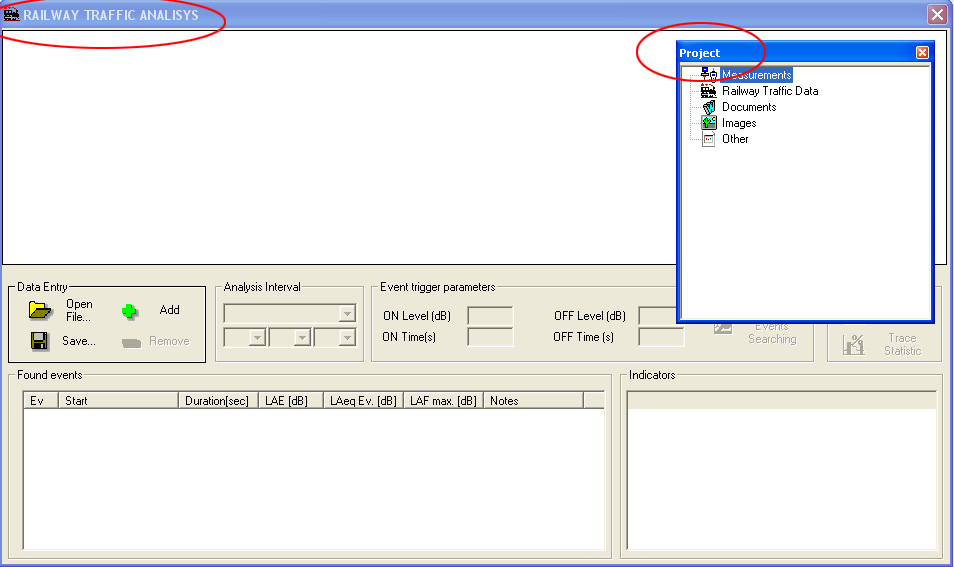
Then you will get two windows:
-
The working environment window: Project
-
The analysis window: Railways Traffic Analysis
Data Input and
Event Detection
After having created the Project working environment and opened the analysis window, proceed as follows:
1. Choose Open File and select the file containing the performed measurements.
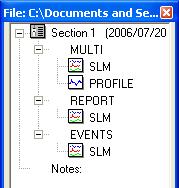
2. You will get the Source List window, that contains the measurements recorded by sections (Section).
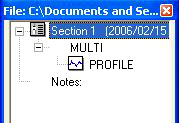
3. To display the contents of a section, click once on the corresponding icon (Section1 in the example). To display the measurements, double click on the corresponding icon (PROFILE in the example).
4. According to the type of data, you will get different windows (please see Data Sources).
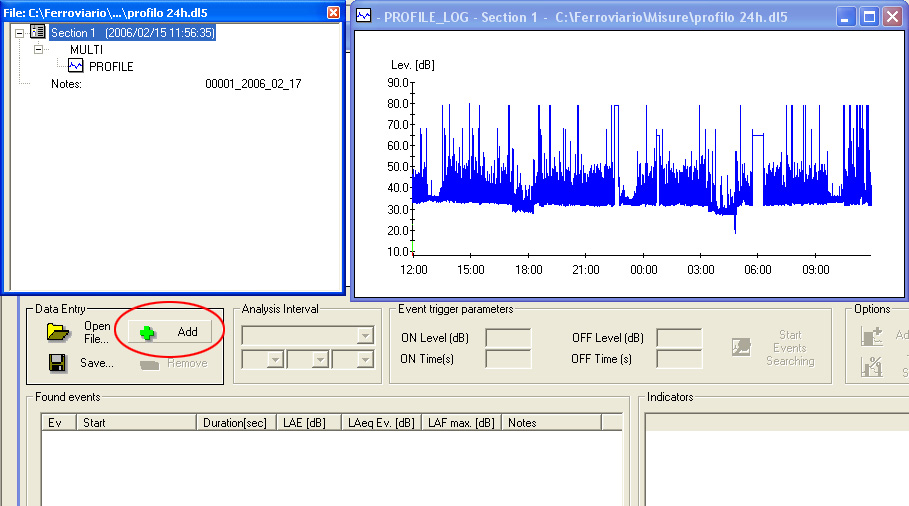
For the MULTI PROFILE data you will get the following:
5. Select the window containing the measurements and
press Add ![]()
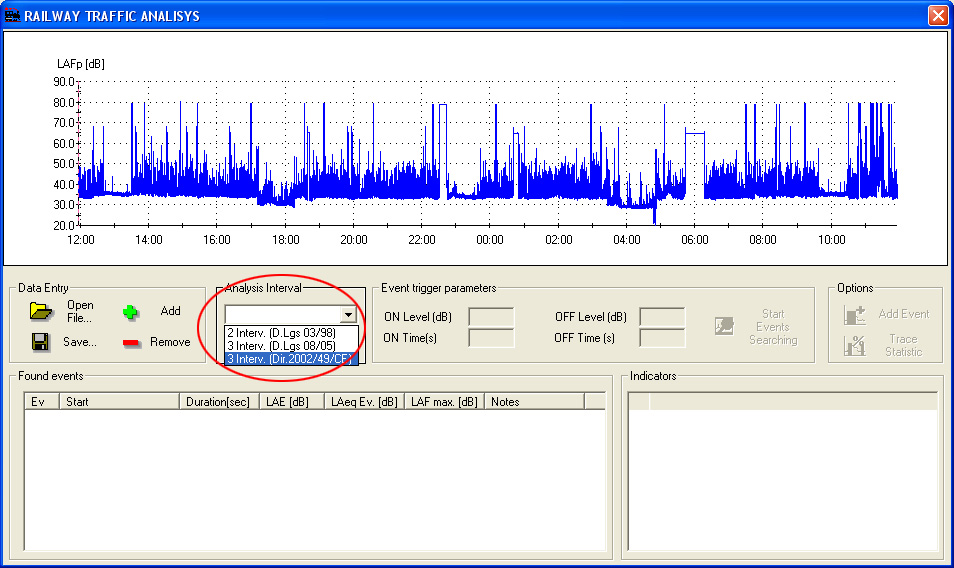
6. Once you have entered the sound trace, you need to select the norms for the analysis
(Italian norms D.Lgs. 03/1998 or D.Lgs. 08/2005 - European Community norms Dir. 2002/49/CE).
7. Then you need to set the parameters for the automatic detection of passages:
- Activation Level - Activation Time
When the sound level exceeds the Activation Level for at least a period equal to the Activation Time the program recognizes a possible sound event linked to a passage.
- Deactivation Level - Deactivation Time
The event is ended when the sound level is lower than the Deactivation Level for a period equal to the Deactivation Time.
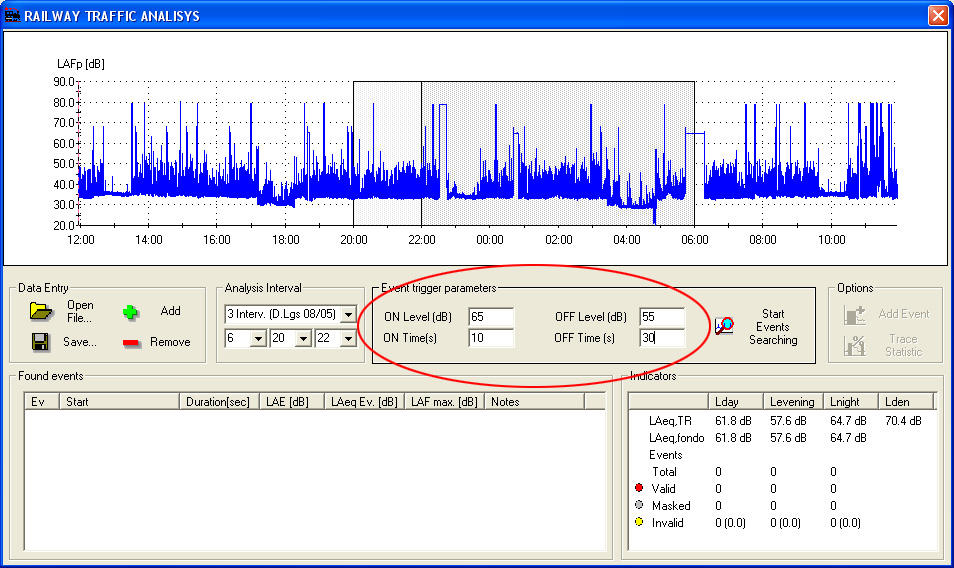
Now you can press Start Event Search.
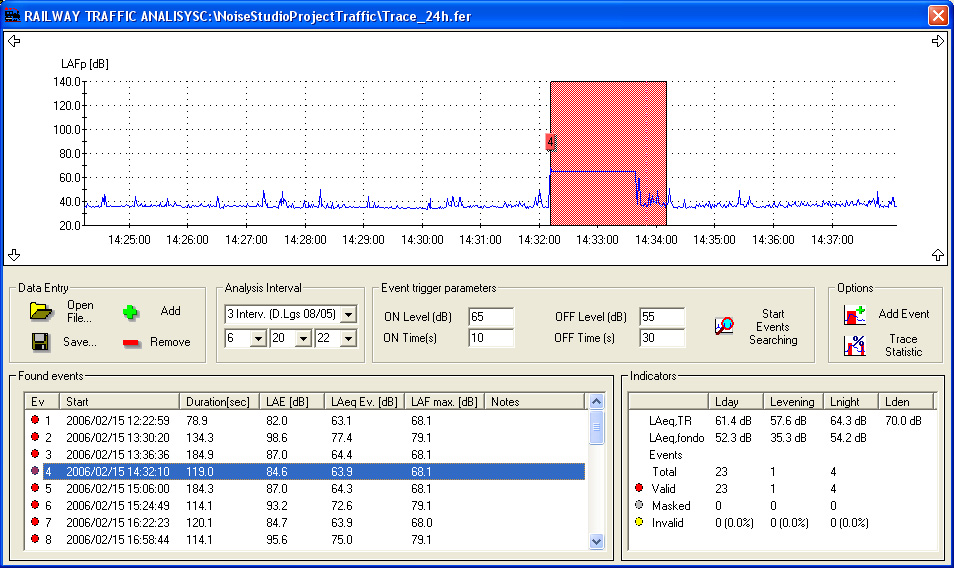
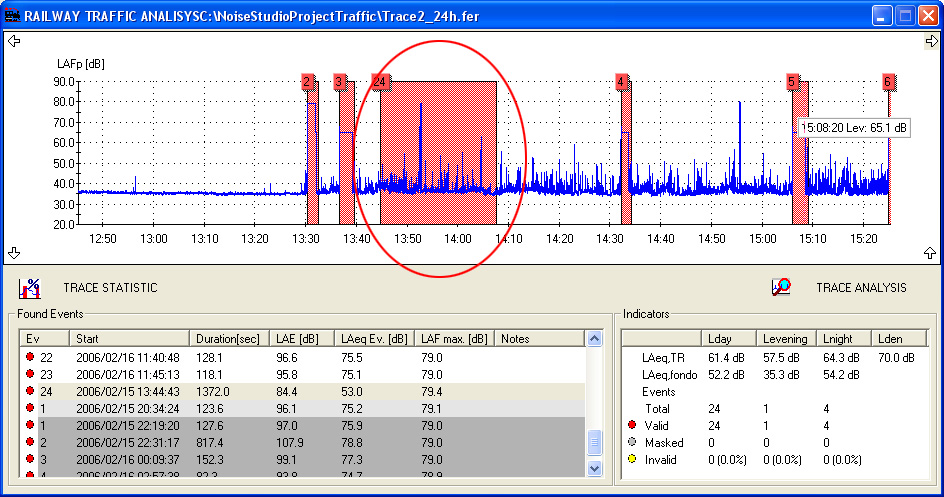
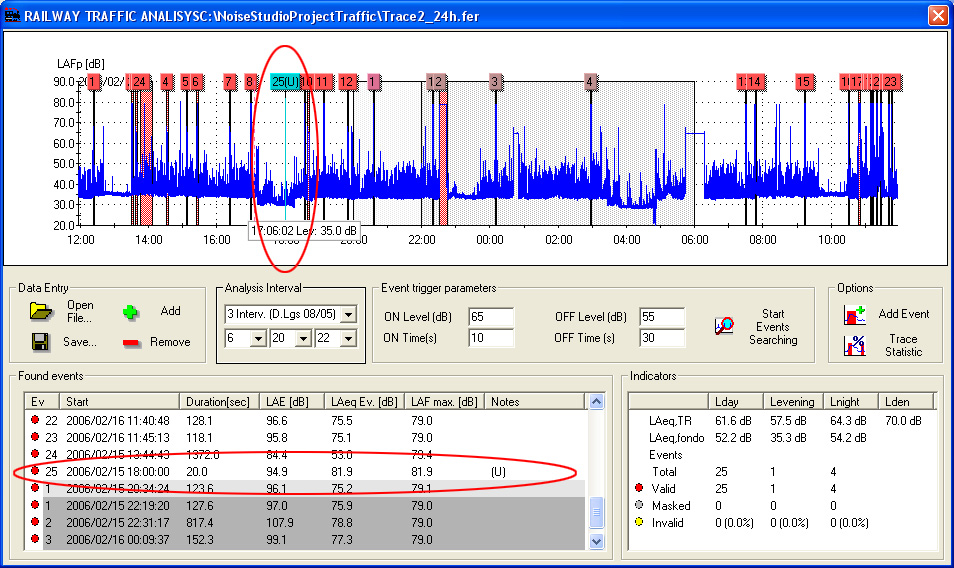
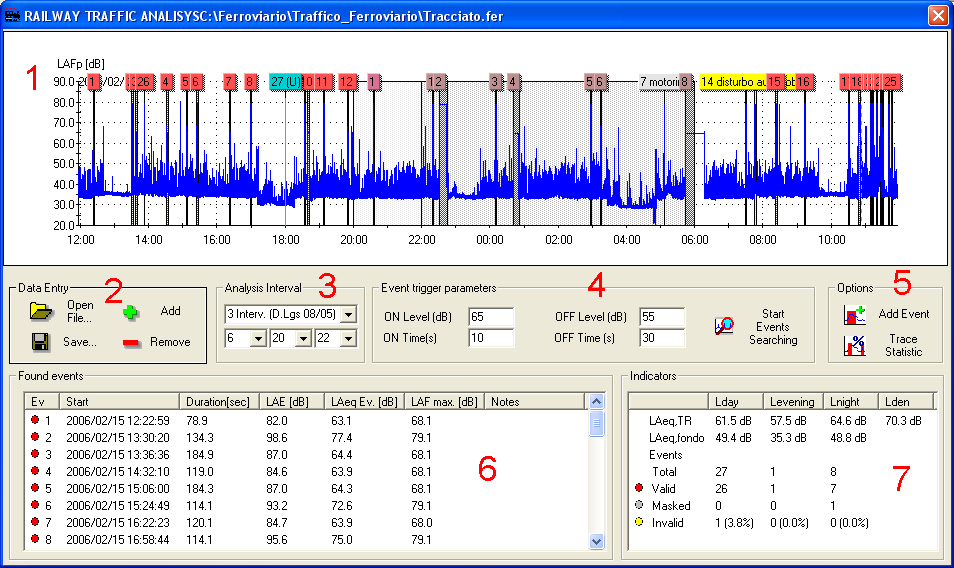
8. The software will proceed with the automatic event detection and show the following screen.
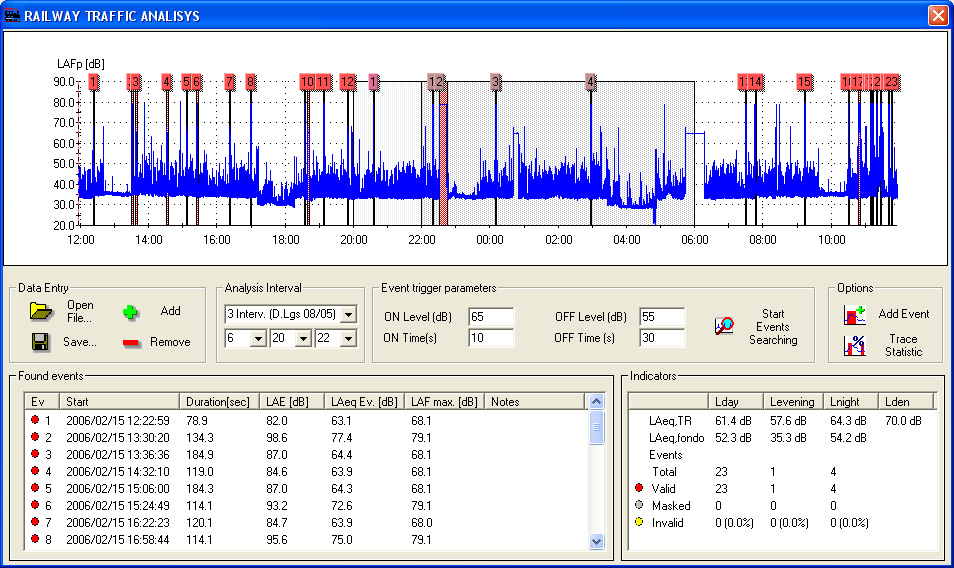
The software highlights the events on the graph using numeric labels grouped according to the various analysis intervals.
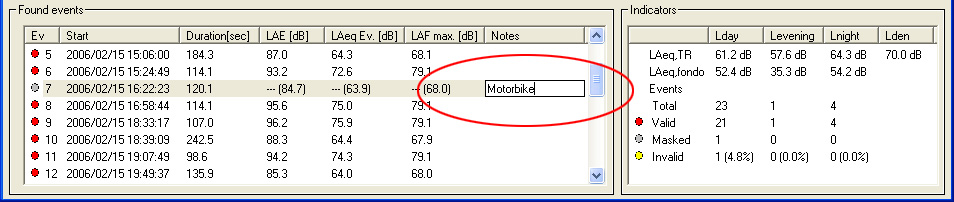
All detected events are collected into a list (bottom left) that shows per each event:
- Start date
- Duration
- SEL
- LAeq
- LAF max
- Notes
Instead, on the lower right, you will get the following results: Leq, day, evening, night and global TR descriptors and the percentages of valid, invalid and masked events.
You can process the captured events: masking, change duration, enter notes, statistics display (please see Event Management)
The results can be saved
into a .fer
extension file, and added to the Project folder, by clicking
on File >> Save or on the
Save ![]() key.
key.
The saved sound traces can be recovered and displayed in the following window.

By pressing "SOUND TRACE ANALYSIS", the software allows reloading of the sound trace in the analysis window for new processing.
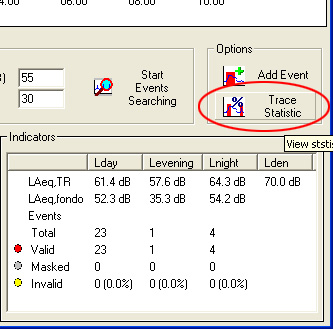
By pressing "SOUND TRACE STATISTICS" you can enable the statistics analysis window for the whole sound trace. It will show the event statistics and the residual noise statistics.
Sound Trace Statistics
By pressing "Sound Trace Statistics" you can enable the statistics analysis window for the whole sound trace. It will show the event statistics and the residual noise statistics.
You can display the distribution of probabilities by pressing "Distr. Prob."
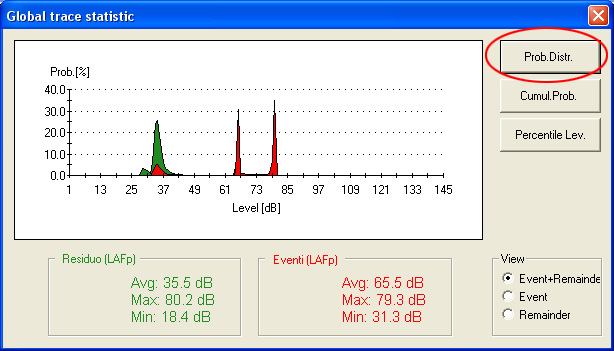
You can display the cumulative probability by pressing "Prob. Cumul."
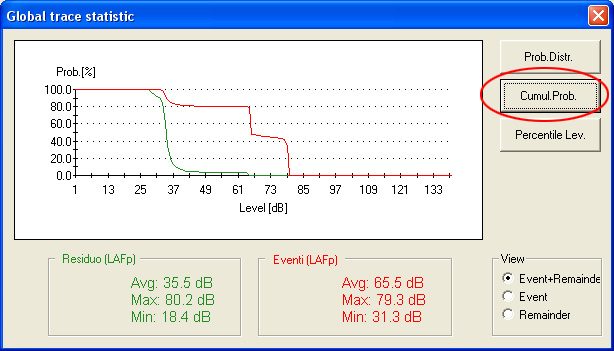
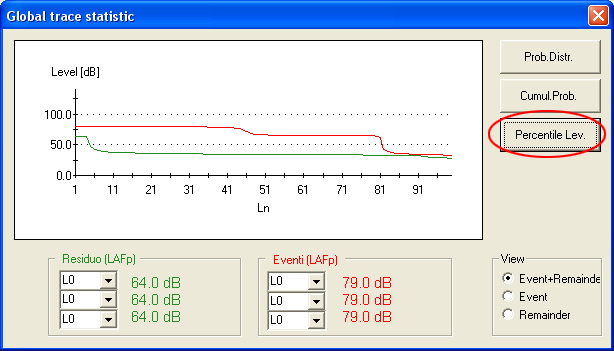
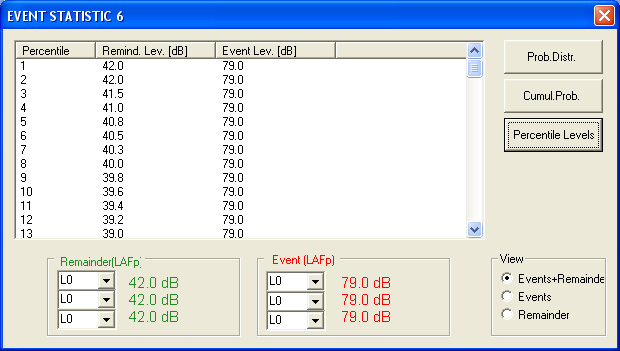
You can also display the percentile levels by pressing "Percentile Lev."
You can also display the information
as a table using the ![]() key or
the "View->Table" menu item.
key or
the "View->Table" menu item.
You can also export the tables to
Excel using the ![]() key or selecting the "File->Export
to Excel" menu item.
key or selecting the "File->Export
to Excel" menu item.
You can also copy the graphs and
table to the Windows Clipboard using the
![]() key or
selecting the "Tool->Copy to Clipboard" menu item.
key or
selecting the "Tool->Copy to Clipboard" menu item.
Event Management
The software shows all detected events into a list (bottom left), grouping them according to day (1), evening (2) and night (3) events.
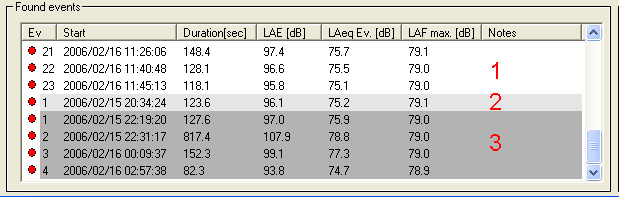
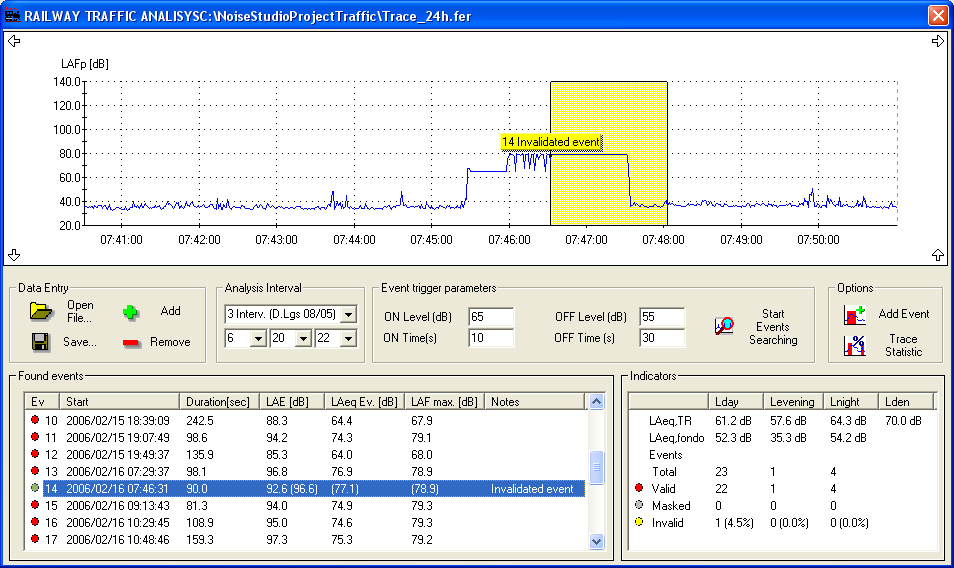
By selecting an event in the list using the mouse, it will be shown on the graph.
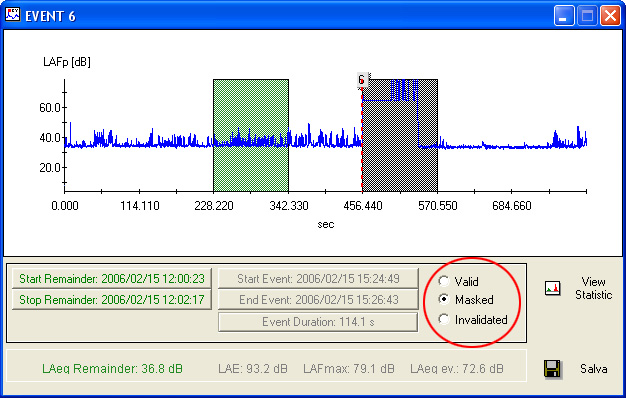
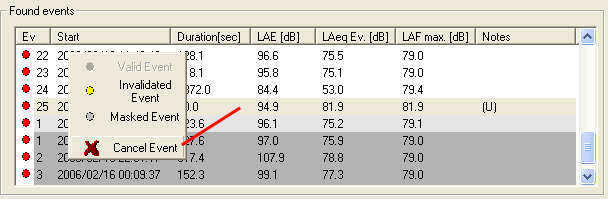
A right click on the element in the event list opens a menu that allows to activate, mask, invalidate or clear that event.
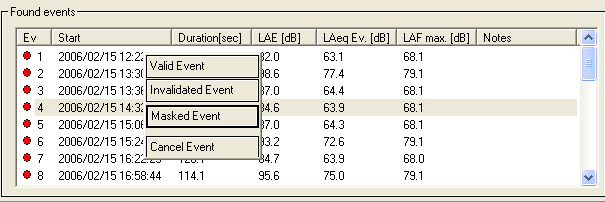
By invalidating the event, its values (SEL, LAeq Ev, LAFmax) are replaced with the average values of the other events in the interval, for calculation of the descriptors.
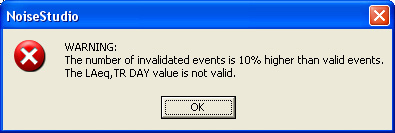
If the number of invalid events exceeds 10%, the measurement cannot be considered valid and you will get a warning message.
When masking the event, its values are not considered in the descriptor calculation.
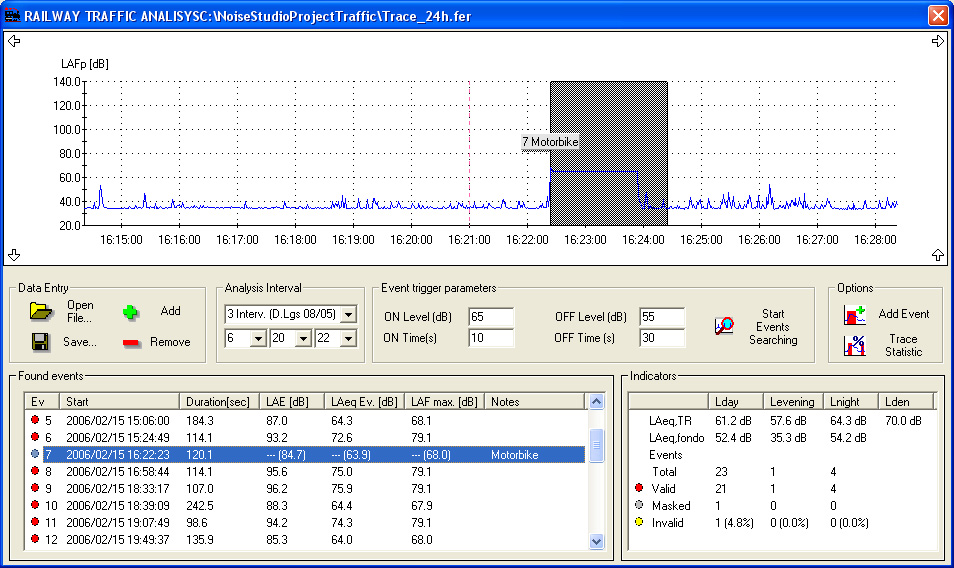
You can also add a user note per each changed event.
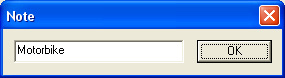
By clicking on the notes field in the event list, you can add a personal note to each event.
Detailed Event Analysis
By double clicking on an event in the event list, you will get a window with the detailed analysis of that event.
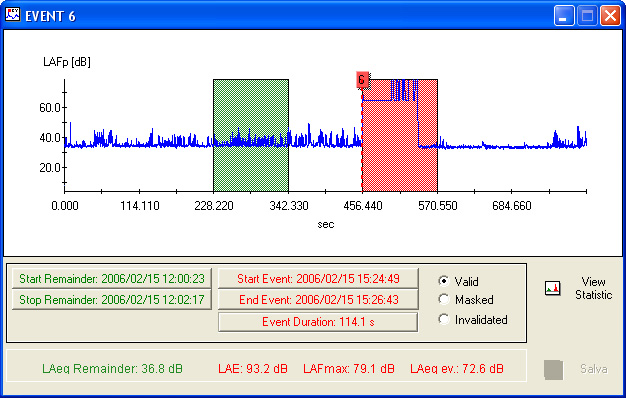
It shows the sound trace, the time interval for residual Leq calculation and the time interval for calculation of the event parameters.
By clicking on "Event Start" and "Event End", you can change the event analysis time interval with consequent variation of the SEL, LAFmax, Leq ev parameters.
You can also mask or invalidate the event being examined.
The event changes should be confirmed using the Save key.
You can also display the information
as a table using the ![]() key or the "View->Table" menu item.
key or the "View->Table" menu item.
You can also export the tables to
Excel using the ![]() key or selecting the "File->Export to Excel" menu item.
key or selecting the "File->Export to Excel" menu item.
You can also copy the graphs and
table to the Windows Clipboard using the
![]() key or
selecting the "Tool->Copy to Clipboard" menu item.
key or
selecting the "Tool->Copy to Clipboard" menu item.
Event Statistics
You can display the event statistics using the View Statistics key:
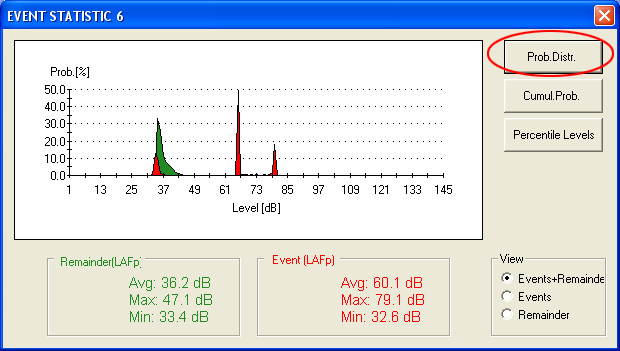
You can choose to display the event statistics, the residual, or both.
In addition to the distribution of probabilities, you can also display the cumulative probability
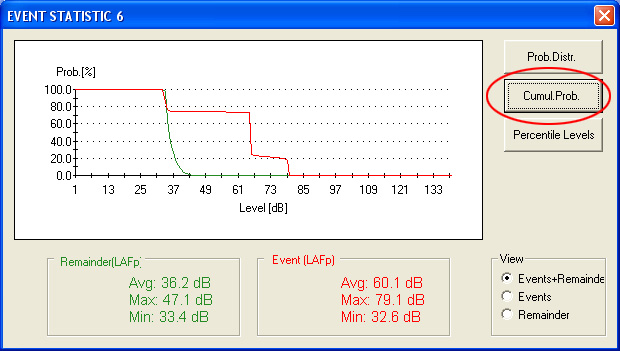
or the percentile levels.

You can also display the information as a table
using the ![]() key or the "View->Table" menu item.
key or the "View->Table" menu item.
You can also copy the graphs and
table to the Windows Clipboard using the
![]() key or
selecting the "Tool->Copy to Clipboard" menu item.
key or
selecting the "Tool->Copy to Clipboard" menu item.
You can also export the tables to
Excel using the ![]() key or selecting the "File->Export to Excel" menu item.
key or selecting the "File->Export to Excel" menu item.
Manual Input of Events
Once the automatic detection of passages is ended you can add some events manually by finding them on the sound trace or entering them from scratch.
Finding an event on the sound trace.
To add an event by finding it on the sound trace press "Add Event"
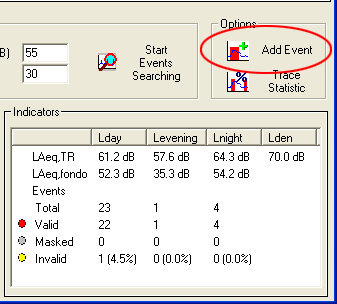
and select the "Find Event on the Graph" option.

Select the sound trace section to be considered as an event using your mouse and press "INSERT".
(You can repeat the selection sequence until you are able to isolate the desired part)
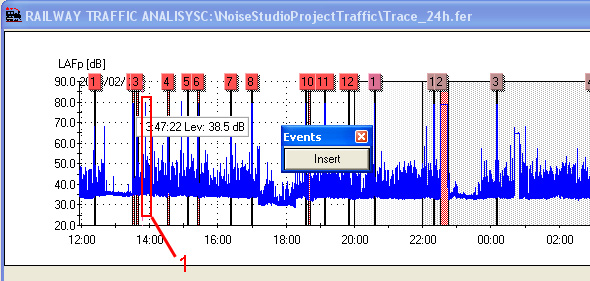
The software will mark the selected area (1) as an event and will update the event list and the results.
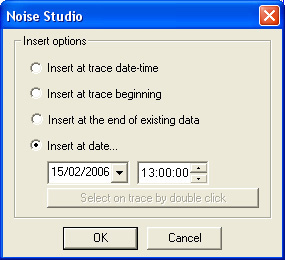
Enter an event from scratch
To add an event from scratch press "Add Event"
and select the "Enter Data" option.
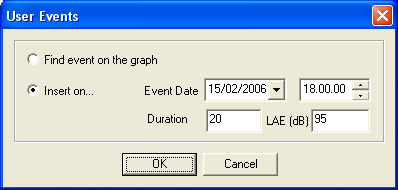
Enter the event date, time, duration and SEL and press "OK".
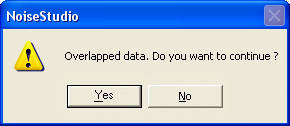
The software will ask to check for any overlapping with the existing sound trace.
Select the "Check Overlapping and Insert" option.
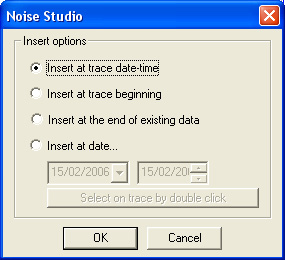
Confirm it in the following window
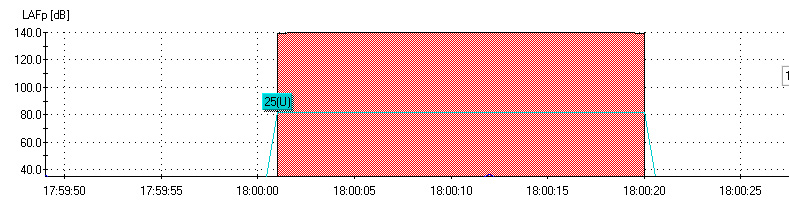
The software will add a blue-highlighted event and will add a "(U)" note
It will then update both the event list and the results.
In particular, the user event input from scratch will be displayed using a constant light blue sound trace over the instrument measured trace.
The Leq constant value on the interval duration will give the set SEL.
To clear an event, you just need to right click on it in the event list and select Clear Ev.
Input additional sound traces
After inputting a sound trace, you can manually add other traces over the first one.
You only need to open the file containing the data to
be added and press the Add ![]() key in the analysis window.
key in the analysis window.
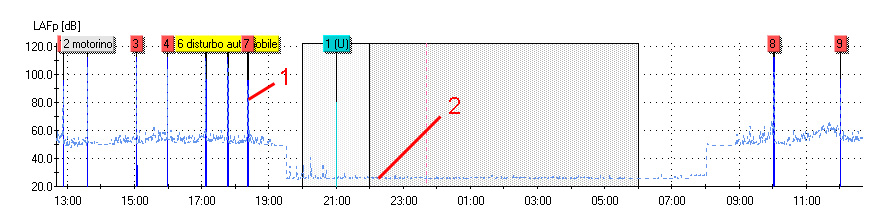
The program will ask the type of data to be input
and then will insert the new data (1) over the existing ones (2).
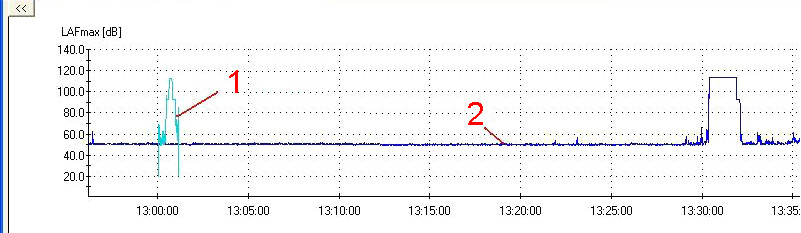
The program allows creation of a 24-hour sound trace from partial traces by joining them according to the data in the file or the customer selections.
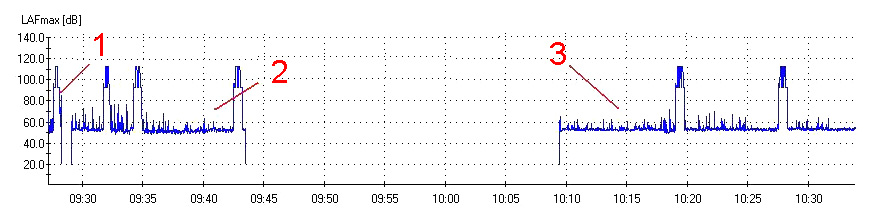
You only need to open the data file to be added, press
the Add ![]() key and select the insert option in the window
key and select the insert option in the window
At the end, you will get the following type of sound trace: 1=first trace, 2=second trace, 3=third trace.
![]()
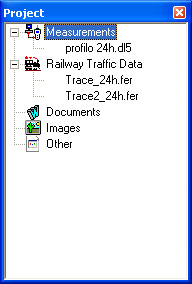
The Project
The Project window is the program working environment.
The Project is a collection of the files that make up a processing report.
These files are organized as follows:
|
|
The NoiseStudio program allows opening the NoiseStudio files (*.dl5) that contain the measurements performed by the sound level meter, or the files captured by the Monitor software (*.dr5).
These measurements are displayed in the Source List and can be simultaneously managed on several windows.
The program can also open multiple files simultaneously.
To delete a measurement file you just need to select it and choose
the File->Remove from Project menu item, or the ![]() icon on the Toolbar.
icon on the Toolbar.
These are the files of the different sound traces containing the events and the analysis results. The program can also open multiple files simultaneously.
To delete a sound trace file you just need
to select it and choose the File->Remove from Project menu
item, or the ![]() icon on the Toolbar.
icon on the Toolbar.
In this section are collected all text files that contain information on the project.
By double clicking on the Documents item in the Project window, you can create a new document.
To add any already existing document, please see “Insert New Files in the Project”.
To delete a document you just need to select it
and choose the File->Remove from Project menu item, or the
![]() icon on the Toolbar.
icon on the Toolbar.
In this section are collected all image files that contain information on the project.
By double clicking on the Pictures item in the Project window, you can create a new picture.
To add any already existing picture, please see Insert Files in the Project
To delete a picture you just need
to select it and choose the File->Remove from Project menu
item, or the ![]() Toolbar
icon.
Toolbar
icon.
In this section are collected all different files that contain information on the project.
To add any already existing file, please see Insert Files in the Project.
To delete a file you just need to
select it and choose the File->Remove from Project menu item,
or the ![]() Toolbar icon.
Toolbar icon.
Insert
Files in the Project
You can add any type of already existing files to the project (measurement files, sound trace files, documents, pictures, etc.)
To insert the file in the project, proceed as follows:
1. Select File >> Open or click on
![]() and open the desired file.
and open the desired file.
2. Click on File >> Add to the Project
or on the ![]() key.
key.
Now the file is in the Project. To open it, just double click on its name.
To delete any file in the project you just need to select it and choose
the File->Remove from Project menu item, or the ![]() icon on the Toolbar.
icon on the Toolbar.
Create a New Project
To create a new working environment
(Project), please select File
>> New Project, or click on the ![]() key in the Toolbar.
key in the Toolbar.
To delete a project, you just need to delete its folder using “Explorer” in Windows.
Data Sources
The software accepts any data from NoiseStudio (*.dl5) and Monitor (*.dr5) files.
The source list for NoiseStudio files shows the files corresponding to the different logging sessions, with the recording start date, the type of file and any possible note by the user.
|
You can have the following data
|
To select a file you only need to left click on the type of data you wish to view.
The NoiseStudio program can open NoiseStudio files section by section (Section 1, Section 2, etc.) and multiple NoiseStudio files simultaneously.
By double clicking on Section 1, Section 2, and so on, you will open the Insert Note screen that reports the file's
progressive number, date and possibly the name with which the measurement
session was saved.
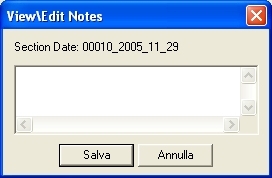
In the space before the progressive number (area indicated by the figure) you can enter a note on the current section in order to better identify it.
The source list for Monitor files shows a single file with the recording start date and the type of file.
|
You can have the following data |
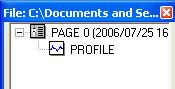
To select a file you only need to left click on the name PAGE.
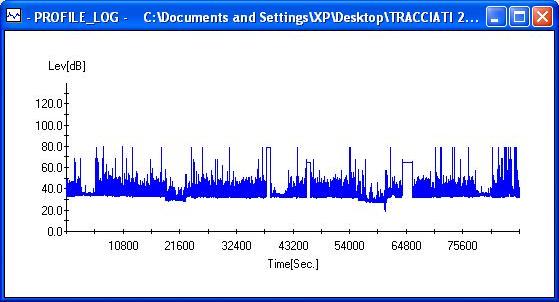
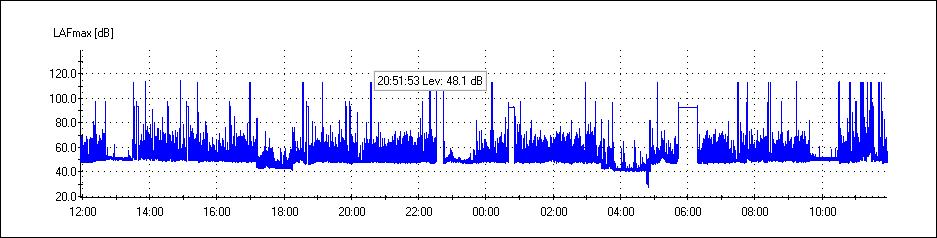
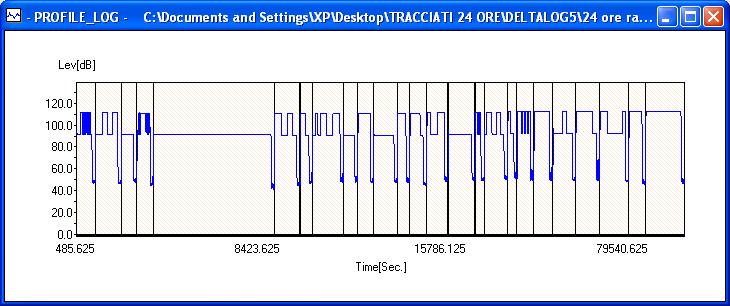
The MULTI PROFILE data types are shown in the PROFILE_LOG window.
To be compatible with the railways traffic analysis window, they should contain the LAFmax parameter or the LAeq parameter. They will give the following sound trace in the analysis window:
The data from the advanced analyzer are shown in the report window SLM_REPORT and in the event recording window PROFILE_LOG.
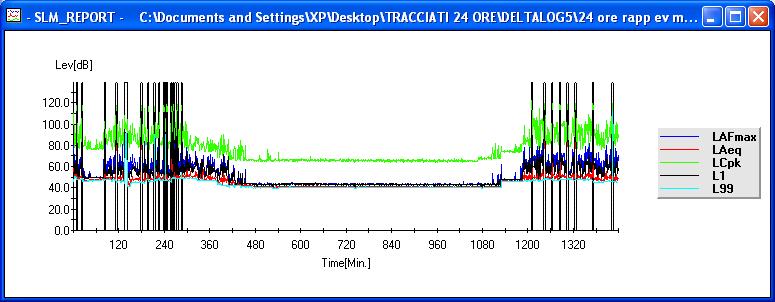
To be compatible with the railways traffic analysis window, they should contain:
- The LAeq parameter in the report
- The LAFmax or LAeq parameter, in case of PROFILE data types
They will give the following trace: the sound trace of the report for the full 24 hours (2), and the overlapping profile of the events (1).
Monitor Data Types
With regard to the data acquired by the Monitor software ( *.dr5), to be compatible with the railways traffic analysis window they should be PROFILE data types, and contain the LAFmax or LAeq parameter.
They are displayed according to the same modes of the NoiseStudio data types.
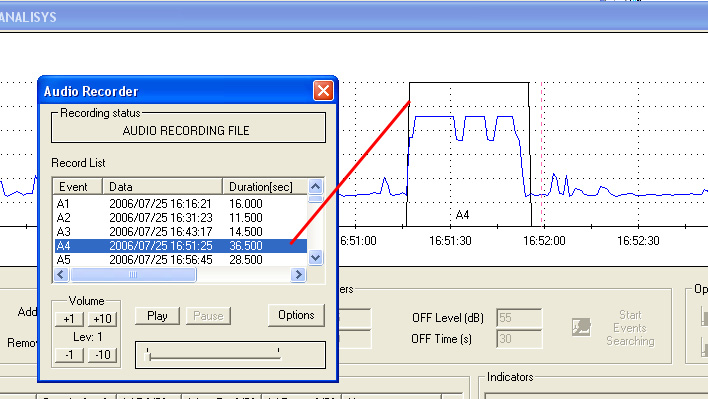
In particular, the data from the Monitor software can be linked to audio recordings marked by the symbols A1, A2, etc.

These audio files and their references are also transferred to the analysis window.
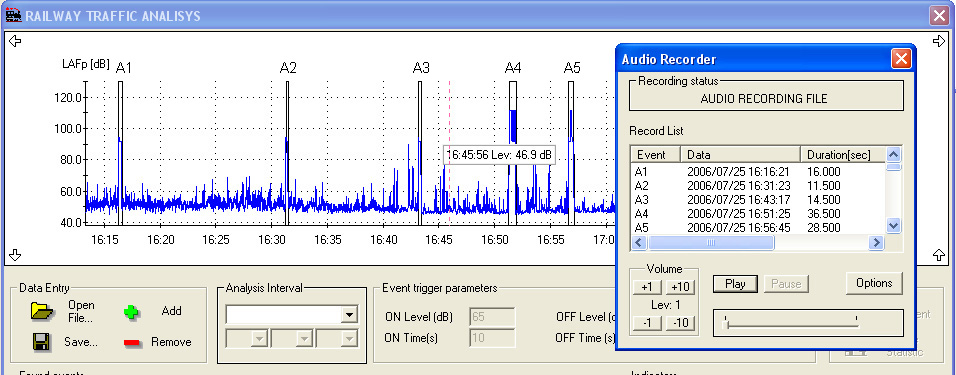
By selecting an audio file in the Audio Recorder window, the concerned event will be shown on the graph.
By pressing play the recorded audio will be played, and you will also see the indicator of the current recording position.
Railways Traffic Analysis Window
The analysis aimed at detecting the passages and determining the noise levels is performed in the Railways Traffic Analysis window.
You can see following areas:
- Sound Trace Graph
- File Management keys
- Open File key
- Add key
- Erase key
- Save key
- Analysis Interval Selection Box
- Event Trigger Parameters
- Activation Level
- Activation Time
- Deactivation Level
- Deactivation Time
- Start Event Search key
- Options keys
- Event List
- Result List
-
Sound Trace Graph
It shows the data time trend. It is used with a 1 second time resolution even if the input data have a higher resolution (1/8 sec).
-
Open File key
It allows opening a file to select the input data.
-
Add key
It allows adding the currently displayed file to the sound trace to be analysed.
-
Erase key
It clears the input sound trace, or only a selected part if the zoom is enabled.
-
Save key
It saves the sound trace.
-
Analysis Interval Selection Box
It allows choosing the analysis mode according to two intervals (Italian norms D.Lgs. 03/1998) or three intervals (Italian norms D.Lgs. 08/2005 - European Community norms Dir. 2002/49/CE)
-
Event Trigger Parameters
- Activation Level - Activation Time
They define the level and time according to which the software considers the event has started.
- Deactivation Level - Deactivation
Time
They define the level and time according to which the software considers the event has ended.
- Start Event Search
It starts the automatic event search according to the defined parameters.
-
Event List
It collects the events detected by the software according to the Event Trigger Parameters.
You can operate on each single event to add notes, invalidate or mask the event, display the event in detail with the relevant statistics.
-
Result List
It collects the results from the calculation of the detected events, giving the LAeq, TR descriptors, and the percentages of valid, invalid and masked events.
![]()
Main Menu
The upper part of the page contains the main menu from which all functions offered by the NoiseStudio application can be accessed.
To activate a function you only need to select it with the mouse from the drop-down menu. According to the context, some menu items are disabled (grey) and are not active.
Each detail and function of the various commands are listed and illustrated in the following pages.
File Menu
Open
It opens a saved file. The files managed by the application
have a dl5, dr5 and fer extension.
Save as…
It opens the window to save the current file.
Close
It closes
the active file.
Close All
It closes all open files.
New Project
It creates a New Project.
Open
Project
It opens an existing project.
Close Project
It closes the project.
Add
to Project
It adds the file to the current project.
Remove from the Project
It removes a file from the project. To remove
a file from the project, select the file in the Project
window and click on File >> Remove from the Project, or on the
corresponding key in the Toolbar.
Export
to Excel
It exports the displayed data to Excel.
Print
A command to print the displayed file.
Analyse
Menu
The submenu contains the function:
Worker Protection
It enables the windows to perform
the analysis of the noise exposition in the working environment, from
the measurements performed - see Use
of the NoiseStudio program.
Railways
Traffic
It enables the Railways
Traffic Analysis window for the analysis of the noise made by railways
traffic.
View Menu
The View submenu contains the following functions:
Table
It displays the data of the
files as a table.
Graph
It displays graphically the data of the files.
Table & Graph
It displays the data of the DL5 files as a table and graphically.
3D
Graph
It displays three-dimensionally the OCTAVE, TOCTAVE
and FFT types of data of the DL5 files.
Level Map
It displays the OCTAVE, TOCTAVE and FFT types of
data of the DL5 files as a colour level map.
FFT Resolution
It allows editing of the frequency
resolution for data such as Single FFT.
You can choose among:
-
100 Hz resolution and from 94 to 21563 Hz interval
-
12 Hz resolution and from 12 to 2462 Hz interval
-
1.5 Hz resolution and from 7 to 290 Hz interval
FFT Scale
It allows editing of the amplitude scale between logarithmic (dB) and
linear (Pa).
Under-range Level
It allows showing or hiding the under-range level.
View Absolute Date-Time
It allows editing of the time scale from relative view to absolute view.
Toolbar
It enables or disables the Toolbar
that contains the keys.
Status
Bar
It enables or disables the program status bar at the bottom of the screen.
The other non-highlighted functions are not enabled.
Tool Menu
The Tool submenu contains the following functions:
Copy to Clipboard
This command Copies the current window to the Windows®
Clipboard (graph or table) and allows it to be pasted in another application.
After selecting the menu item Copy, open the destination application
(editor, spreadsheet, graphic application, ...) and use the Paste
(or Paste Special if available) command to paste the Windows®
Clipboard contents.
Zoom +
It enables the Zoom+ function on the Measurements Window and
current window. Select the desired area by holding the right button
of the mouse. When you release it, the selected area will be enlarged.
Zoom -
Returns to the previous zoom level.
Statistics Proc.
It enables the statistics processing on the currently selected Measurements Window.
It is available only for STAT type measurements both single and recordings.
It allows choosing among:
-
Probabilities
-
Cumulative Probability
-
Percentile Levels
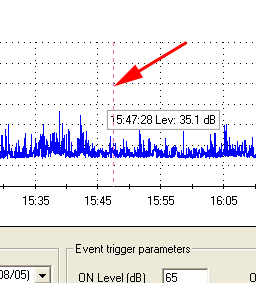
Insert Label
It allows inserting a label in the graph.
By clicking on the graph you will see the Label Settings window.
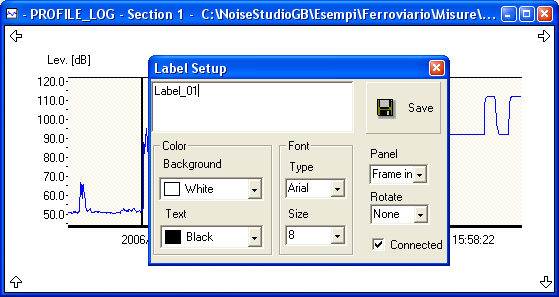
Type the note and, after choosing
the Colour, Font and Type
of Box, press ENTER on the keyboard.
To edit the label click on it.
To edit the graph, right click on it. You will get the following drop-down menu:
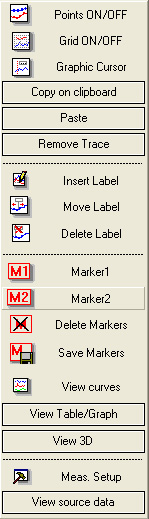
Its items are:
-
Points ON/OFF: Select this item to show or hide the points on the graph.
-
Grid ON/OFF: Select this item to show or hide the grid on the graph.
-
Graphic Cursor: Select this item to show or hide the vertical graphic cursor.
-
Copy/Past/Remove trace: as the Windows copy, past and cut functions.
-
Insert Label: insert a label on the graph.
-
Move Label: It shifts the selected label position on the graph
-
Delete Label: It removes the selected label.
-
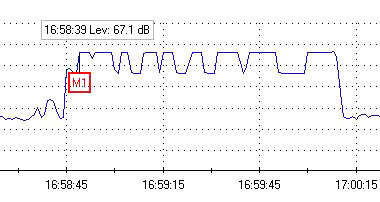
Marker 1: It enables the first marker. By moving the pointer to the desired point and left clicking on it you can fix the marker.
-
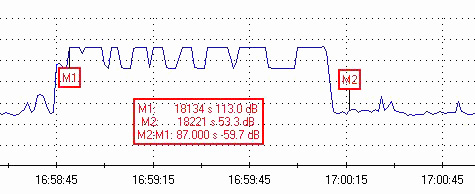
Marker 2: It enables the second marker. By moving the pointer to the desired point and left clicking on it you can fix the marker. As soon as the second marker is fixed, you will get a label indicating the value of the two markers and their difference. This label moves with the mouse. By moving the pointer to the desired point and left clicking on it you can fix the label.
-
Erase Marker: It erases the marker.
-
Grid ON/OFF: Select this item to show or hide the grid on the graph.
-
Measurement Settings: By selecting this item, you will open a window with the instrument measurement settings.
-
View Curve: It display a specific curve on the graph (only for multiple line graphs, in the dl5 and dr5 files).
Reverberation Decay
It allows displaying the time trend of the measurements performed during the reverberation time calculation.
Filter by Amplitude
It allows filtering of the data concerning the reverberation time according to the amplitude difference between signal and background noise.
Filter by Correl. Coeff.
It allows filtering of the data concerning the reverberation time according to their correlation coefficient.
Schroeder's Integral
It enables or disables the display of the time trend of the measurements performed during the reverberation time calculation, acquired with the Schroeder's Integral method.
Software Update
It starts the program automatic update via web.
Menu ? (Help)
The Help submenu contains the following functions:
NoiseStudio Info
It gives the information about the program version.
NoiseStudio Licence
It gives the information about the program licence.
NoiseStudio Manual
It opens the user's manuals for the different installed Software
Modules.
Quick Guide
It opens the Quick Guide for the
different installed Software Modules.
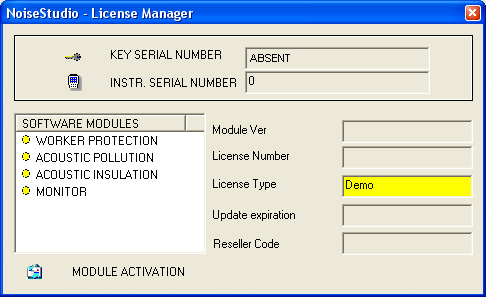
Software Activation
Visualize the current activation
status of the modules. If you did not purchase the license, the
module is supplied under DEMO condition.
Under this condition all the software functions are enabled but
you can only use the sample files as input data, which are availabe
in the CDRom NoiseStudio - Sample Files (D:\Esempi\).
If you have the basic version of the software without modules and you wish to buy the user license for one or more modules, please contact your distributor. The software will be supplied along with the proper key already activated: in order to use the module, it is necessary that the hardware key is pluged into a USB port of the PC.
If you already have one or more activated modules with proper hardware key and you want to buy another one:
press key "Activate module",
Contact your supplier and give him the code of the module you should purchase.
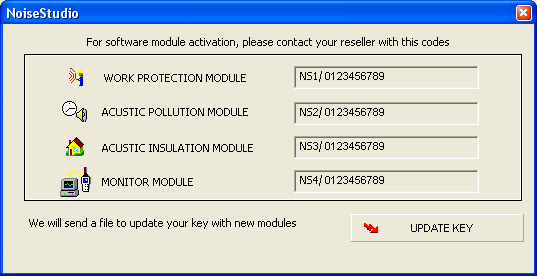
Once you have the file, plug the key into a USB port of the PC and press the key "Update key": select the file received by the supplier and confirm with OK. The hardware key will be updated with the new module.
![]()
To speed up the use of the system, some operations accessible
trough the main menu are also located on a command bar in the form of buttons
immediately beneath the main menu.
This is the Toolbar.
The keys, corresponding to the relevant menu commands, are:
|
|
Open File |
|
|
Save as… |
|
|
New Workspace |
|
|
Open Workspace |
|
|
Add file to Workspace |
| |
Remove file from Workspace It removes the selected file from the Workspace. It is enabled as soon as you select any file in the Project. |
| |
Instrument Manager |
| |
Worker protection >> Start analisys It starts the Worker protection module. |
| |
Acoustic climate >> Start analisys It starts the Acoustic climate module. |
| |
Railway/Airport Traffic >> Start analisys It starts the Railway/Airport Traffic module. |
| |
Tone research It starts the Tone research function. |
| |
Impulse research It starts the impulse research function. |
| |
Acoustic insulation >> Start analisys It starts the Acoustic insulation module. |
| |
Monitor >> Start analisys It starts the Monitor module. |
|
|
Copy to Clipboard |
|
|
Export to Excel |
|
|
Print |
| |
Zoom+ |
|
|
Zoom- |
| |
Insert label |
|
|
View table |
| |
View graph |
| |
View table and graph |
| |
Levels map |
| |
3D graph |
|
|
? >> NoiseStudio Handbook |
Audio Recording
The Monitor software can record on PC the audio associated to the passage of the various trains.
In order to record the audio associated to the various passage, you need a PC fitted with an audio card and a hard disk of suitable capacity (1 minute of recording uses about 5 MB).
Connect the sound level meter LINE output (right connector) to the LINE input on the audio card (or the microphone input).

Launch the Monitor software, connect the sound level meter and enable the monitor function from the menu item:
"Instrument >> Monitor".
Select Profile as the channel to be monitored (the LAFmx parameter should be set) and enable the Activate Audio Recording item.

The program will assess the hard disk free space giving the maximum recording time. The audio recording will be automatically disabled by the software as soon as the disk space is insufficient.

The audio card configuration window will open.

Access the Volume section and enable only the input line channel (or microphone).

Now you need to set the amplitude and time thresholds that define the event and that start and end the audio recording.

When the sound level exceeds the Activation Level (On Level) for at least a period equal to the Activation Time (On Time) the program recognizes a possible sound event linked to a passage and starts the audio recording.
The event is considered complete and the audio recording stopped when the sound level is lower than the Deactivation Level (Off Level) for a period equal to the Deactivation Time (Off Time).
Press OK to confirm the settings and begin the data capture on the PC.

The software will record the numeric trace from the sound level meter and will wait for an event in order to activate the audio recording.

As soon as the sound trace exceeds the set limits, also the audio recording will start.

When the level returns under the threshold, the audio recording is stopped and saved on file with the indication of the event start date and duration.

At the end of the monitoring period you will get the numeric trace with the different audio events. Now the data will be saved.
The saved data are loaded on the NoiseStudio program and will give the following sound trace. The audio events A1, A2, etc. will be highlighted.
By clicking on an event of the Record List in the Audio Recorder window, you will see the corresponding sound trace. By pressing play you can listen to the event. An audio indicator will show the sound trace part being played.
Limitation of Liability
Delta Ohm Srl will not be liable for any direct or indirect damage arising out of use of this software.
Delta Ohm Srl will provide updated information for the software, but does not guarantee its completeness and reserves the right to change the software contents and legal notes in any moment without prior notice.