Noise Studio is a post-processing program that can perform sound analyses in compliance with current Italian and European Community norms. The analysis functions are grouped in software modules that can be enabled using a licence.
The analysis environment gives several display functions (as a table or graphically) of the different sound measurements and processed results. All graphs and tables can be exported to other applications in the Windows® environment. The analysed data and results can usually be stored as Workspaces, together with other documents, so as to allow future checks and analyses.
You can process both the data downloaded from the sound level meter memory and the data captured directly by the PC's memory using the Monitor program.
The "Sound Insulation" module was designed to determine the passive acoustic requirements of buildings in agreement with D.P.C.M. of 05/12/1997.
In particular, it manages measurement and calculation of:
average reverberation time
equivalent absorption area / absorption coefficient
airborne noise insulation between two rooms (R, R', DnT indices)
façades and relevant elements' insulation (Rtheta and D2m,nT)
ceiling impact noise insulation (Ln, D, L'n, L'nT)
A summary guide accompanies measurements taken in agreement with ISO norms.
The software includes a database of walls and ceilings with relevant indices and frequency behaviours.
This software works in conjunction with the HD2010 and HD2110 sound level meters equipped with the reverberation time measurement option.
To launch the program, double click on the NoiseStudio icon using the
left button of the mouse ![]()
or click Start and select All Programs >> Delta Ohm >> NoiseStudio.
This program, once started for the first time, asks
for an activation hardware key, otherwise it works under Demo condition.
Under this condition all the software functions are enabled but you can
only use the exmples files as input data, which are available in the CDRom
NoiseStudio - Sample Files (D:\Esempi\IsolamentoAcustico\).
In order to get the hardware key for the module activation, please contact your distributor (HERE below are the details).
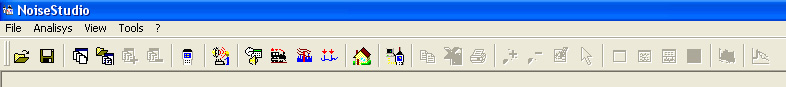
When you start the program, the main window will open with the following control panel: Main Menu and Toolbar.
NoiseStudio uses the data acquired by the sound level meter and calculates
the coefficient which evaluates buildings' passive acoustic requirements
according to ISO norms. Analysis of a building requires various measurements.
These can be grouped inside one "container" so as to simplify
their filing and retrieval.
Moreover, in addition to actual measurements, it may be useful to have
a technical report, some comments,... or graphs, illustrations,... being
an integral part of the job and that could easily be recovered if required.
This "container" is the Workspace.
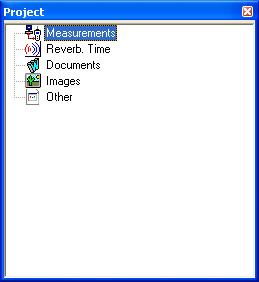
| To start a new Workspace, press New Workspace: the data analysis window opens. |
Select the type of measurement and press OK.
The program will ask if you wish to create a project or open an existing one.
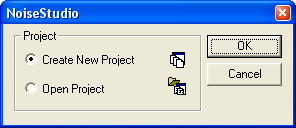
In the following example, the project was called "Example".
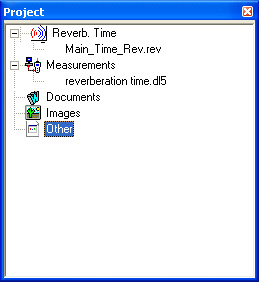
The measurements concerning average reverberation time and/or equivalent absorption area are grouped under the Reverberation Time item.
Perform the selected measurement as reported below.
On being saved, the measurement is added to the measurements making up the project:
Similarly, you can add new measurements to the Workspace:
| using the Start Analysis key |
|
| or, if the measurement is already open, |
|
| using the Add file to Workspace key. |
|
| To remove a measurement in the Workspace, select it and press Remove file from Workspace. |
The Documents item collects all text documents
("doc" extension) such as technical reports, notes,
... which have been entered by the user.
To add an existing document double-click on Documents. A window
will open to select the file to be inserted.
To create a new document, double-click on Documents, enter the
name assigned to the file, and press OK. The application linked to the
extension "doc" (e.g. WordPad) is started: edit the text and
save the file. Upon closing editor, the new document is saved to the Workspace
and appears in the Workspace window.
The Pictures item behaves similarly, and collects image files with "bmp" and "jpg" extensions. The display application is that associated to the "bmp" and "jpg" extensions, respectively (e.g. PaintBrush).
The Miscellaneous item, collects all the files that are not included in the above categories: e.g. "pdf" extension files (Adobe Acrobat), "zip" compressed files, ... etc.
Please note that each time a new item is added to the Workspace, the correspondent file is copied in its folder.
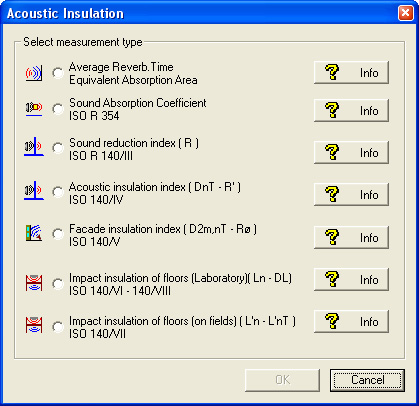
The list of measurement types managed by the software is shown in the Analisys >> Acoustic Insulation >> Start Analisys menu item.
Each item is accompanied by a description of the measurement it refers to: press INFO to access it.
The reported description does not replace the norm details but briefly describes its essential points: to proceed with the measurement it is recommended that all needed operating information is directly acquired from the reference norm.
The measurements available are the following:
Laboratory measurement of the impact-noise insulation coefficient Ln
On site measurement of the impact-noise insulation coefficient L'n, L'nT
Average reverberation time is a basic parameter in building acoustic measurements.
It is obtained from the average reverberation times, frequency by frequency, measured in different room points and with the source in various positions.
Starting from a series of measurements acquired by the sound level meter with reverberation time measurement function, the NoiseStudio software calculates the average value of one of the EDT, T10, T20 or T30 parameters.
Please see the description of the measurement here.
Procedure
Download the data files into a PC folder.
Select the menu item Analisys >> Acoustic Insulation >> Start Analisys.
In the window that opens, select the Average Reverberation Time - Equivalent absorption area measurement and click on OK to confirm.
The program will ask if you wish to create a project or open an existing one.
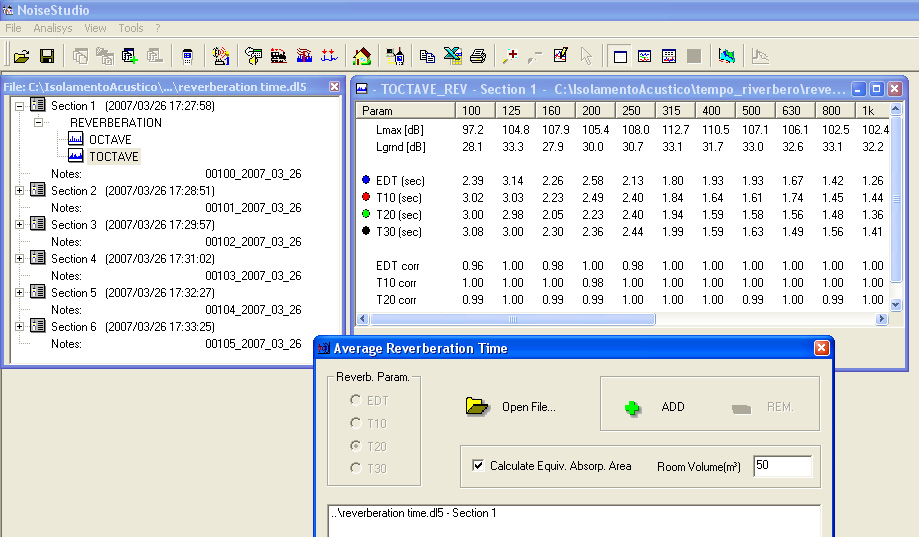
This opens the Average Reverberation Time main window.
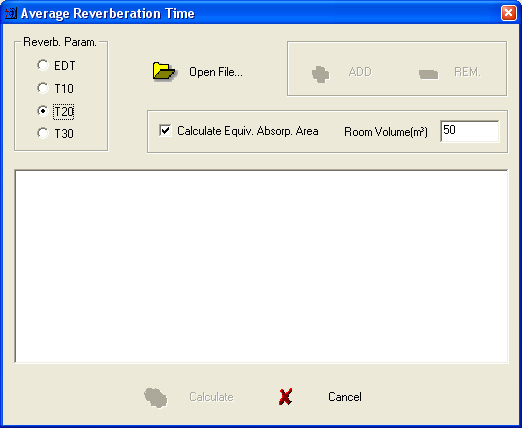
After selecting one of the time parameters (T10, T20, T30 or EDT) to calculate the average, press Open File to open the data file (dl5 extension) previously downloaded from the sound level meter or the example files.
The file appears in the application main page, behind the Average Reverberation Time window, as shown in the example below:
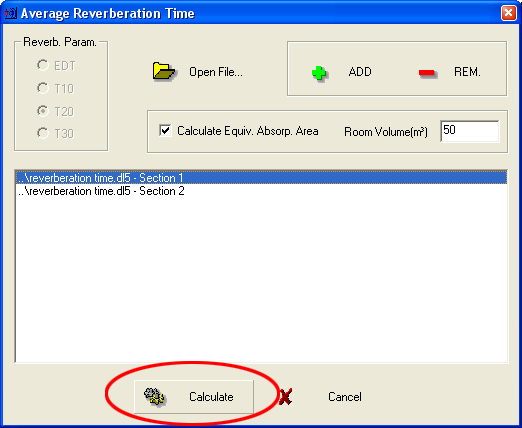
To add the just opened file's data, press |
The appropriate filters concerning the correlation coefficient and width are applied to the data which were added to the list, as requested by the norm.
Repeat the same steps for the other reports for which you wish to calculate the average.
| To remove an already added file, select it using the mouse and press |
By double clicking on one of the files in the list, you can open and review the selected file.
To calculate the equivalent absorption area, enter the room's volume to which the decays acquired by the sound level meter refer.
To proceed with the average calculation, press Calculate Average.
The software will calculate the average reverberation time and the equivalent absorption area.
The graph reports the selected parameter trends and, if enabled, the equivalent absorption area (A).
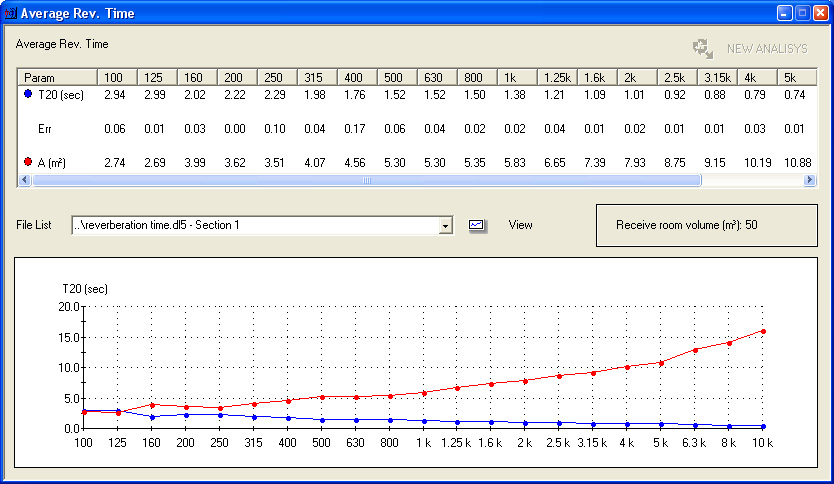
The calculation results are presented in tabular or graphic form. The table reports the chosen parameter values (T10, T20, T30 or EDT), the maximum semidispersion (Err) and, if selected, the equivalent absorption area (A) in square meters.
File List is the list of files for which the average was calculated. By pressing "View", you can review the selected file. |
The results gotten can be
saved (File >> Save as...), |
|
exported to Excel (File >> Export to Excel), |
|
copied to clipboard (Tool >> Copy to Clipboard) or |
|
printed (File >> Print). |
By pressing the "NEW ANALYSIS" key, you can reactivate the analysis window with all files used to obtain that result. |
The sound absorption coefficient characterizes an object's behaviour when invested by a sound wave.
The NoiseStudio software calculates the object's sound absorption coefficient
according to a test room average reverberation times without and then
with the tested object. In addition, the characteristics of the room where
the measurement is performed are considered.
Average values are obtained from the average of a series of measurements
taken at various reverberating room points.
Please see the description of the measurement here.
Procedure
Download the data files into a PC folder.
Select the menu item Analisys >> Acoustic Insulation >> Start Analisys.
In the window that opens, select the Sound absorption coefficient measurement and click on OK to confirm.
The program will ask if you wish to create a project or open an existing one.
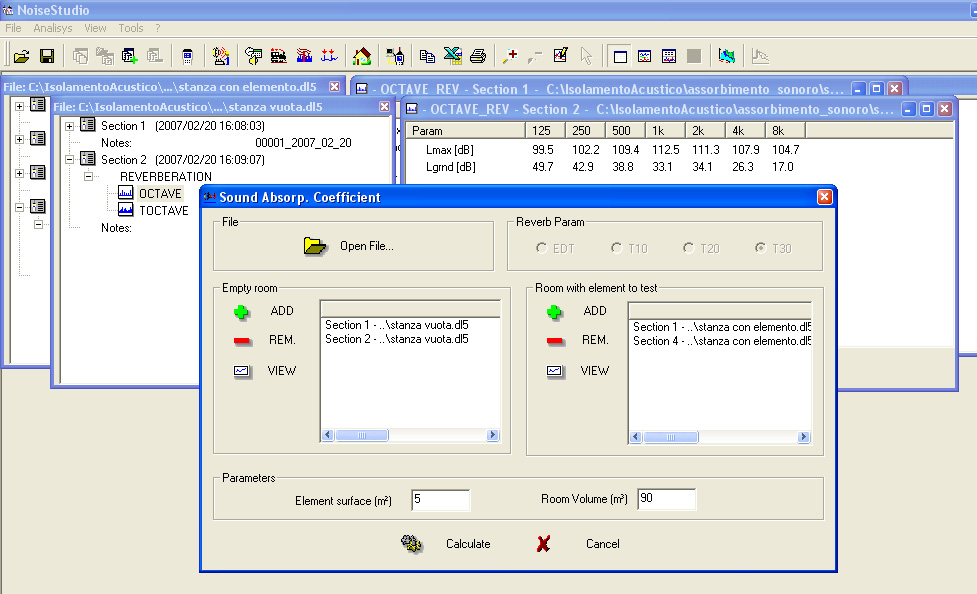
This opens the Sound absorption coefficient main window.
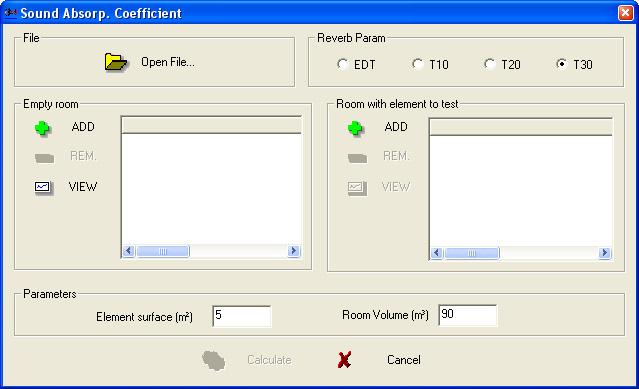
Select one of the time parameters (T10, T20, T30 or EDT) to calculate
the average and enter the element surface and the room volume.
Pressing Open File opens the data file (dl5
extension) previously downloaded from the sound level meter concerning
the empty room measurement, or the example files.
The file appears in the application main page, behind the Sound absorption coefficient window, as shown in the example below:
| To add the just opened file's data, press |
The appropriate filters concerning the correlation coefficient and width are applied to the data which were added to the list, as requested by the norm.
Repeat the same steps for the other captured data for which you wish to calculate the average.
Follow the same procedure to add the data on the room with the tested element present.
| To remove an already added file, select it using the mouse and press |
| To view an already added file, select it using the mouse and press |
To proceed with the coefficient calculation, press Calculate.
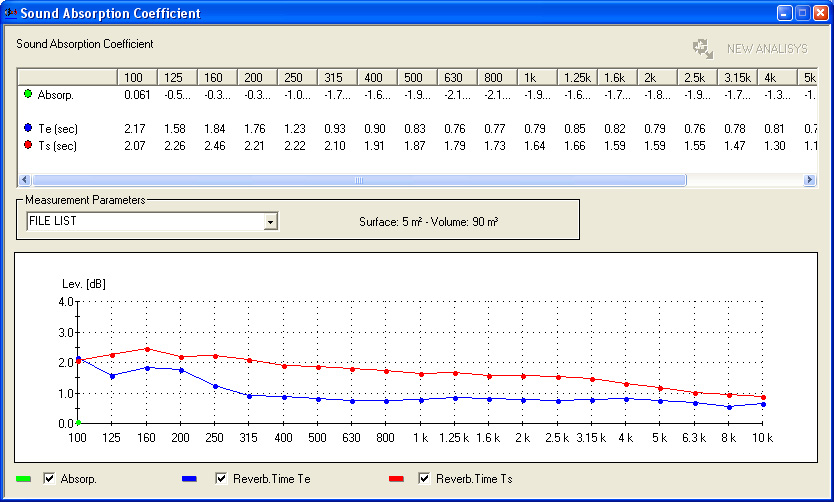
The calculation results are presented in tabular or graphic form. The table reports the absorption coefficient and average reverberation time values concerning the empty room (Te) and the room with the tested element present (Ts).
The FILE LIST is the list of files on which the average has been calculated. Selecting a file from the list, it will be shown automatically.
The results gotten can be
saved (File >> Save as...), |
|
exported to Excel (File >> Export to Excel), |
|
copied to clipboard (Tool >> Copy to Clipboard) or |
|
printed (File >> Print). |
By pressing the "NEW ANALYSIS" key, you can reactivate the analysis window with all files used to obtain that result. |
The Sound reduction index R defines the laboratory insulation capacity of a compartment.
The calculation is carried out by comparing the source and receiving room average sound spectra (after considering background noise effects).
The receiving room equivalent absorption area can be used as calculation correction factor.
Procedure
Download the data files into a PC folder.
Select the menu item Analisys >> Acoustic Insulation >> Start Analisys.
In the window that opens, select the Sound Insulation Index (DnT -R') measurement and click on OK to confirm.
The program will ask if you wish to create a project or open an existing one.
This opens the Sound reduction index R main window.
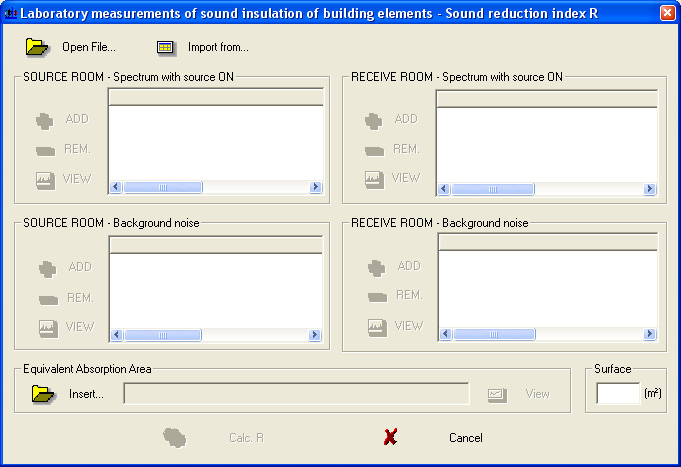
Pressing the Open File upper button, opens the data files (dl5 extension) concerning the measurements of:
source room background noise spectrum (source room - spectrums box)
source spectrum and source room background noise spectrum (source room - noise box)
receiving room background noise spectrum (receiving room - spectrums box)
source spectrum and receiving room background noise spectrum (receiving room - noise box)
Once opened, each file appears in the application main page, as in the following example:
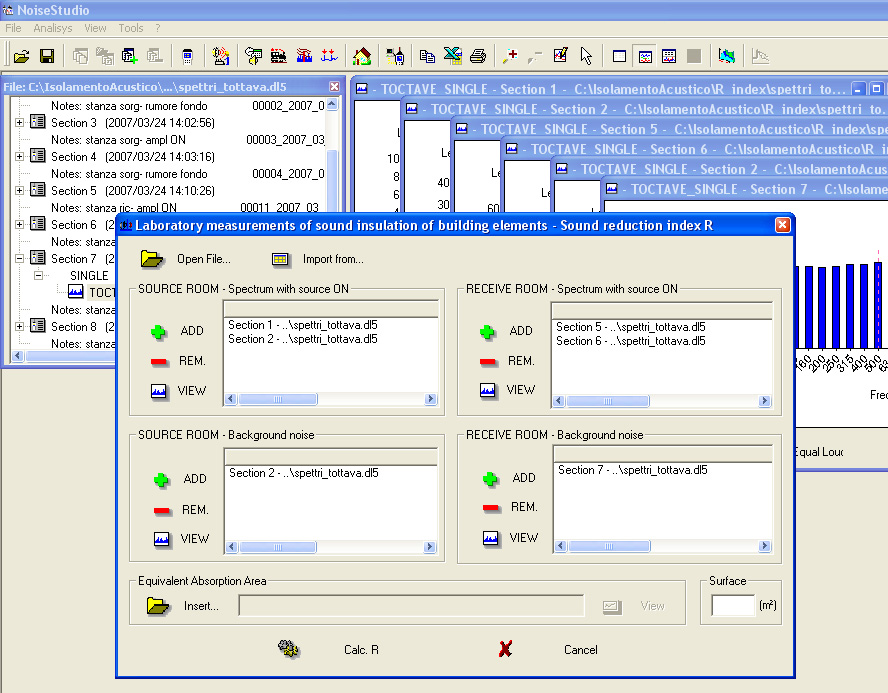
To add the just opened file's data, press |
Repeat the same steps for all measurements.
| To remove an already added file, select it using the mouse and press |
| To view an already added file, select it using the mouse and press |
Import data
Data can also be imported from a file or input manually by pressing "Import from..."

In the window that opens, select the data source:
The From file... option allows adding data from a text file (txt) or Excel file.
Using the Input table option, you can input the data directly into a table and save its contents: if the data belong to an octave spectrum, you cannot edit some cells.
Equivalent absorption area
The correction factor can be introduced by pressing Insert in the Equivalent absorption area section.
Enter the tested separation element surface area in the appropriate box.
To proceed with the soundproofing power calculation, press Calculate R.
The application shows the sound reduction index R trend, as well as the source and receiving room signal average spectrum either as a table or graphically. The equivalent absorption area is only shown in the form of a table.
Furthermore, the measurement environmental parameters (separation element surface) and the global evaluation index Rw are supplied.
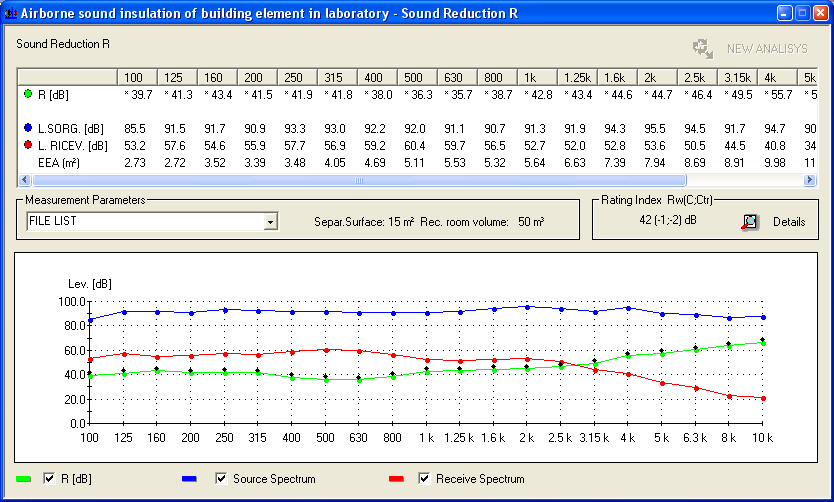
The FILE LIST is the list of files on which the average has been calculated. Selecting a file from the list, it will be shown automatically.
By pressing the ![]() key, the index trend as a function of frequency and compared to the opportunely
shifted ISO reference curve is shown.
key, the index trend as a function of frequency and compared to the opportunely
shifted ISO reference curve is shown.
The results gotten can be
saved (File >> Save as...), |
|
exported to Excel (File >> Export to Excel), |
|
copied to clipboard (Tool >> Copy to Clipboard) or |
|
printed (File >> Print). |
By pressing the "NEW ANALYSIS" key, you can reactivate the analysis window with all files used to obtain that result. |
By selecting the Analisys >> Acoustic Insulation >> Create Report menu item, you can generate an ISO report into an Excel spreadsheet.
Sound insulation index
R' and DnT measurement
The apparent sound reduction index R' and the standardized difference of DnT levels define the insulation capacity of an on site compartment.
The calculation is carried out by comparing the source and receiving room average sound spectra (after considering background noise effects). The receiving room average reverberation time (will give the DnT index) or equivalent absorption area (will give the R' index) can be used as calculation correction factor.
Average values are obtained from the average of a series of measurements taken at various points of the two rooms.
Please see the description of the measurement here.
Procedure
Download the data files into a PC folder.
Select the menu item Analisys >> Acoustic Insulation >> Start Analisys.
In the window that opens, select the Sound Insulation Index (DnT -R') measurement and click on OK to confirm.
The program will ask if you wish to create a project or open an existing one.
The program will ask if you wish to use the single element method, valid when considering only a wall, or the global method, valid when considering more walls.
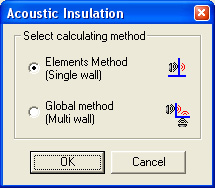
If you use the global method, you first need to assess the single walls insulation using the single element method. Save the results and then apply the global method.
Single element method
This opens the Sound Insulation Index (DnT -R') main window.
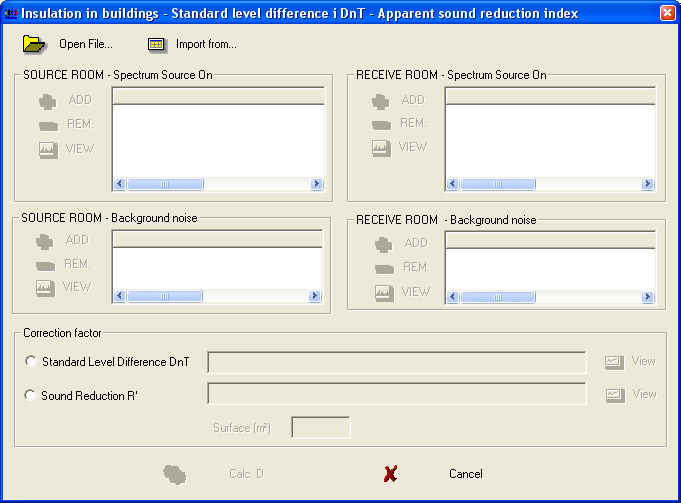
Pressing the Open File upper button, opens the data files (dl5 extension) concerning the measurements of:
source room background noise spectrum (source room noise box)
source spectrum and source room background noise spectrum (source room spectrums box)
receiving room background noise spectrum (receiving room noise box)
source spectrum and receiving room background noise spectrum (receiving room spectrums box)
Once opened, each file appears in the application main page, as in the following example:
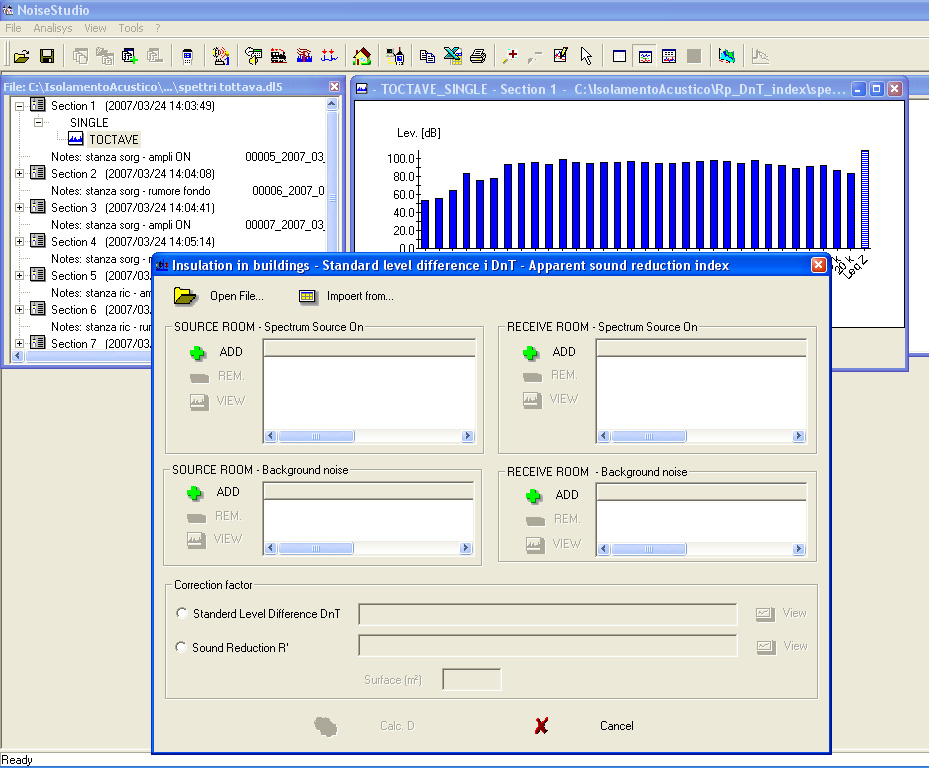
To add the just opened file's data, press |
Repeat the same steps for all measurements.
| To remove an already added file, select it using the mouse and press |
| To view an already added file, select it using the mouse and press |
To proceed with the calculation, select the standardized difference of DnT levels or the apparent sound reduction index R' in the Correction factor window, and input the relevant data.
The Calculate key becomes Calculate DnT, if you selected the standardized difference of DnT levels or Calculate R' if you selected the apparent sound reduction index R'.
To proceed with the coefficient calculation, press Calculate R' or Calculate DnT.
The application shows the R' or DnT index trend, the source and receiving room signal average spectrum as a table or graphically, and the receiving room average reverberation time (or equivalent absorption area if you selected the index R') is only shown as a table.
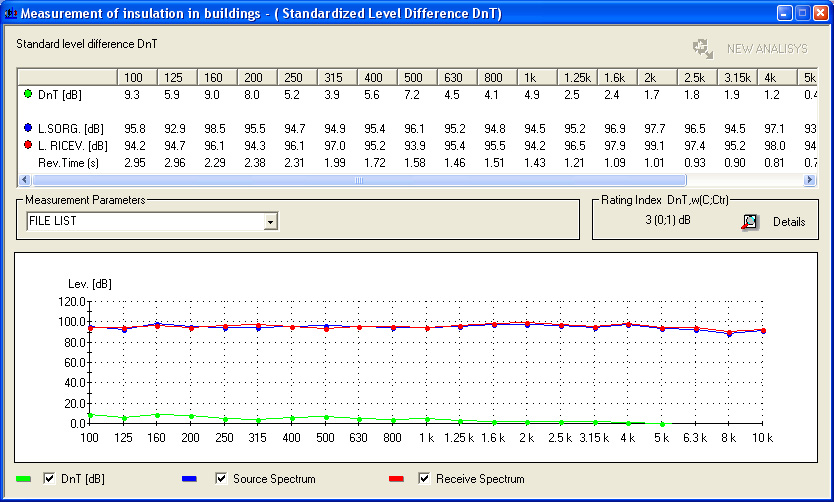
The FILE LIST is the list of files on which the average has been calculated. Selecting a file from the list, it will be shown automatically.
Pressing the ![]() key, the same index as a function of frequency is shown.
key, the same index as a function of frequency is shown.
The results gotten can be
saved (File >> Save as...), |
|
exported to Excel (File >> Export to Excel), |
|
copied to clipboard (Tool >> Copy to Clipboard) or |
|
printed (File >> Print). |
By pressing the "NEW ANALYSIS" key, you can reactivate the analysis window with all files used to obtain that result. |
ISO REPORT
By selecting the Analisys >> Acoustic Insulation >> Create Report menu item, you can generate an ISO report into an Excel spreadsheet.
Global method
This method allows calculation of the standardized difference of DnT levels or the apparent sound reduction index R' for multiple walls.
First you need to calculate the standardized difference of DnT levels or the apparent sound reduction index R' for each single wall using the single element method and saving the results on file.
This opens the Global Sound Insulation Index (DnT -R') main window.
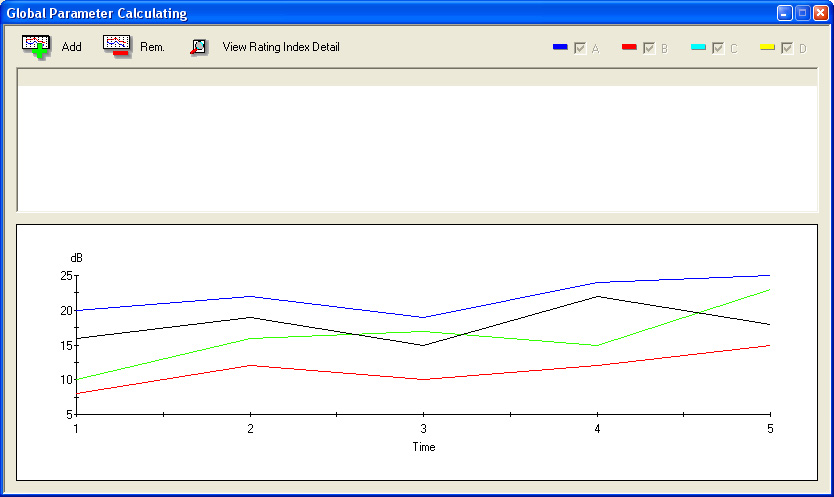
By pressing Add ![]() you can select the files that will give the standardized difference
of DnT levels or the apparent sound reduction index R' previously
calculated using the single element method.
you can select the files that will give the standardized difference
of DnT levels or the apparent sound reduction index R' previously
calculated using the single element method.
The software will add the file and calculate the average according to the formula
![]()
where:
n is the number of source places
Di is the acoustic insulation for every source-receiver pair.
obtaining
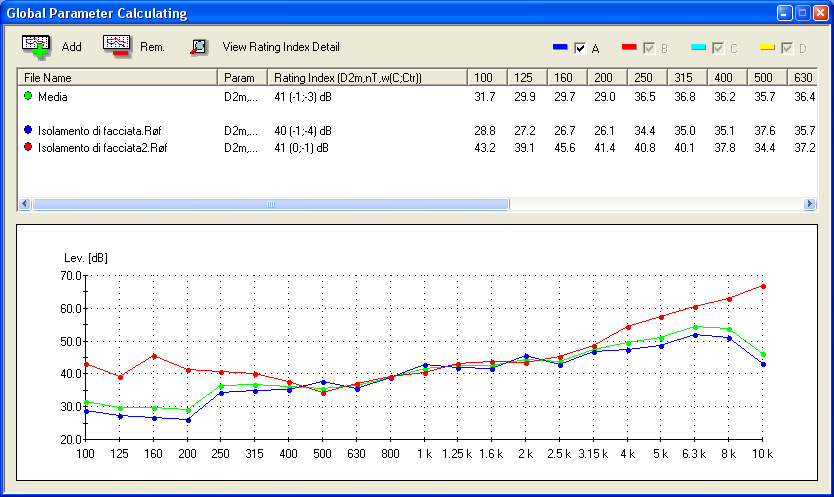
Pressing the ![]() key, the same index as a function of frequency is shown.
key, the same index as a function of frequency is shown.
The results gotten can be
saved (File >> Save as...), |
|
exported to Excel (File >> Export to Excel), |
|
copied to clipboard (Tool >> Copy to Clipboard) or |
|
printed (File >> Print). |
ISO REPORT
By selecting the "Analisys >> Acoustic Insulation >> Create Report" menu item, you can generate an ISO report into an Excel spreadsheet.
The Rtheta e D2m,nT indices, on site, describe the insulation capacity of a building façade element.
The calculation is carried out by comparing the free field source spectrum and receiving room average sound spectrum (after considering background noise effects). The average reverberation time (D2m,nT) or the equivalent absorption area of the receiving room (Rtheta) can be used as calculation correction factor.
Starting from
the spectrum of the speaker used to generate the signal,
the individual background noise and signal spectrums, measured at various points in the receiving room and measured by the sound level meter,
the room' s physical characteristics.
NoiseStudio calculates the façade insulation indices Rtheta and D2m,nT.
Please see the description of the measurement here.
Procedure
Download the data files into a PC folder.
Select the menu item Analisys >> Acoustic Insulation >> Start Analisys.
In the window that opens, select the measurement of the Façade insulation indices (Rtheta and D2m,nT) and confirm with OK.
The program will ask if you wish to create a project or open an existing one.
The program will ask if you wish to use the single element method, valid when considering only a wall, or the global method, valid when considering more walls.
If you use the global method, you first need to assess the single walls insulation using the single element method. Save the results and then apply the global method.
Single element method
This opens the main window of the measurement of the Façade insulation indices (Rtheta and D2m,nT).
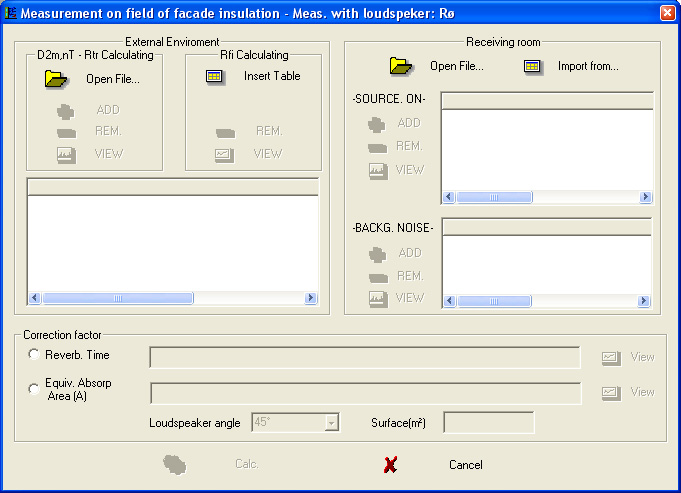
The window is divided into four sections:
Outdoor:
Receiving room it illustrates the signal average spectrum measured in the receiving room (Item SPECTRA) and the background noise spectrum measured in the receiving room in absence of the signal (Item NOISE).
The correction factor collects the data concerning
receiving room average reverberation time or equivalent absorption area
receiving room volume
façade element surface
speaker emission angle.
Use the Open File key, linked to each element of the window, to open the data files (dl5 extension) concerning the previously acquired measurements saved on PC.
As an alternative, you can manually input the data into a table (using the Insert table key) or import them from an Excel or txt file (using the Import from... key).
Once opened, each file appears in the application main page, as in the following example:
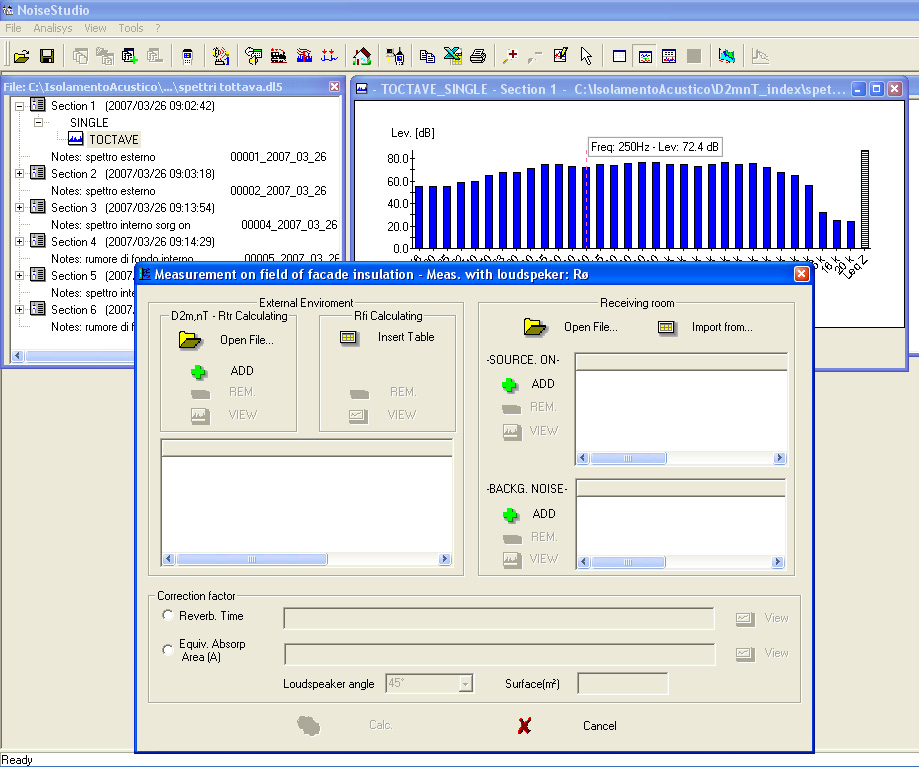
To add the just opened file's data, press |
Repeat the same steps for all measurements.
| To remove an already added file, select it using the mouse and press |
| To view an already added file, select it using the mouse and press |
To proceed with the calculation, press Calculate Rtheta or Calculate D2m,nT.
The application shows the façade insulation index trend, the source and receiving room signal average spectrum as a table or graphically. The receiving room average reverberation time (or equivalent absorption area) is indicated only as a table.
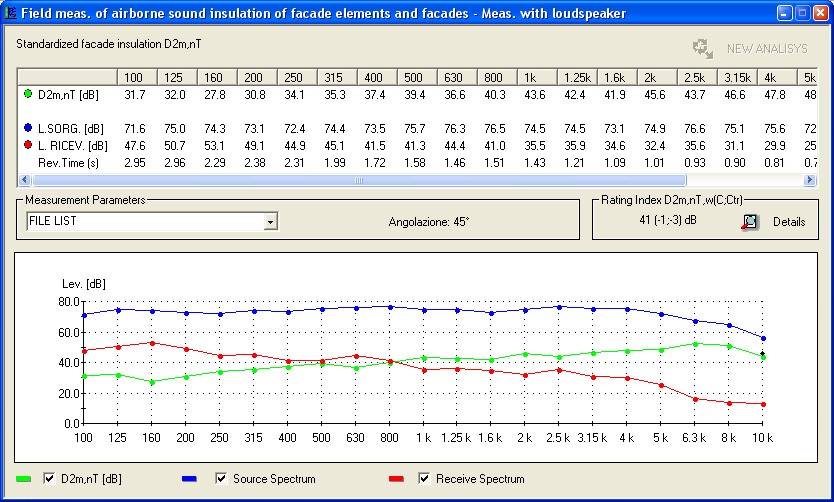
The FILE LIST is the list of files on which the average has been calculated. Selecting a file from the list, it will be shown automatically.
Pressing the ![]() key, the same index as a function of frequency is shown.
key, the same index as a function of frequency is shown.
The results gotten can be
saved (File >> Save as...), |
|
exported to Excel (File >> Export to Excel), |
|
copied to clipboard (Tool >> Copy to Clipboard) or |
|
printed (File >> Print). |
By pressing the "NEW ANALYSIS" key, you can reactivate the analysis window with all files used to obtain that result. |
ISO REPORT
By selecting the "Analisys >> Acoustic Insulation >> Create Report" menu item, you can generate an ISO report into an Excel spreadsheet.
Global method
This method allows calculating the Façade insulation indices (Rtr, D2m,nT and Rtheta ) for multiple walls.
First you need to calculate the Façade insulation indices (Rtr, D2m,nT and Rtheta) for each single wall using the single element method and saving the results on file.
This opens the Global Façade insulation indices (Rtr, D2m, nT and Rtheta) main window.
By pressing Add ![]() you can select the files that will give the Façade insulation
indices (Rtr, D2m, nT and Rtheta) previously calculated using the
single element method.
you can select the files that will give the Façade insulation
indices (Rtr, D2m, nT and Rtheta) previously calculated using the
single element method.
The software will add the file and calculate the average according to the formula
![]()
where:
n is the number of source places
Di is the acoustic insulation for every source-receiver pair.
obtaining
Pressing the ![]() key, the same index as a function of frequency is shown.
key, the same index as a function of frequency is shown.
The results gotten can be
saved (File >> Save as...), |
|
exported to Excel (File >> Export to Excel), |
|
copied to clipboard (Tool >> Copy to Clipboard) or |
|
printed (File >> Print). |
ISO REPORT
By selecting the "Analisys >> Acoustic Insulation >> Create Report" menu item, you can generate an ISO report into an Excel spreadsheet.
In laboratory conditions, the standardized Ln impact-sound pressure level and the sound level pressure reduction D define the ceiling sound reduction capacity.
The calculation is carried out by comparing the receiving room average sound spectrum (after considering background noise effects) when the impact-noise machine is operating in the source room. The receiving room average reverberation time or equivalent absorption area can be used as calculation correction factor.
Please see the description of the measurement here.
Procedure
Download the data files into a PC folder.
Select the menu item Analisys >> Acoustic Insulation >> Start Analisys.
In the window that opens, select the Impact noise insulation (in laboratory) (Ln - DL) measurement and click OK to confirm.
The program will ask if you wish to create a project or open an existing one.
This opens the Impact noise insulation main window.
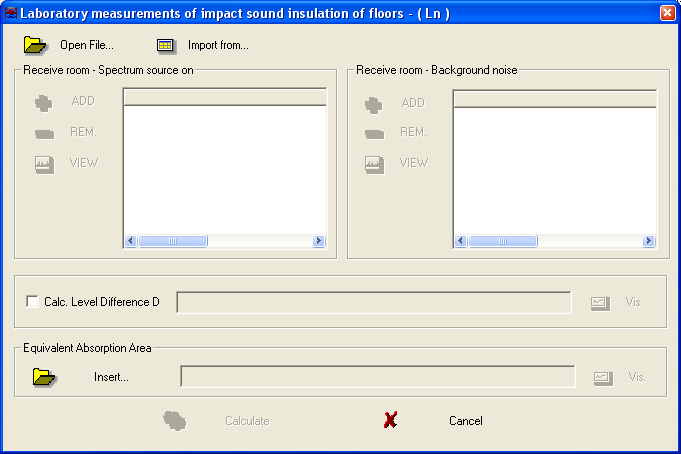
The window is divided into four sections:
Receiving room spectrum describes the signal average spectrum measured in the receiving room.
Receiving room noise describes the background noise spectrum measured in the receiving room in absence of the signal.
Level D difference calculation allows a reference level Lref to be inserted from which the sound level pressure reduction D can be calculated.
Equivalent absorption area collects the data for the equivalent absorption area of the receiving room.
Pressing Open File, opens the data files (dl5 extension) concerning the previously acquired and saved on PC receiving room spectrum measurements.
As an alternative, you can manually input the data into a table (using the Insert table key) or import them from an Excel or txt file (using the Import from... key).
Once opened, each file appears in the application main page, as in the following example:
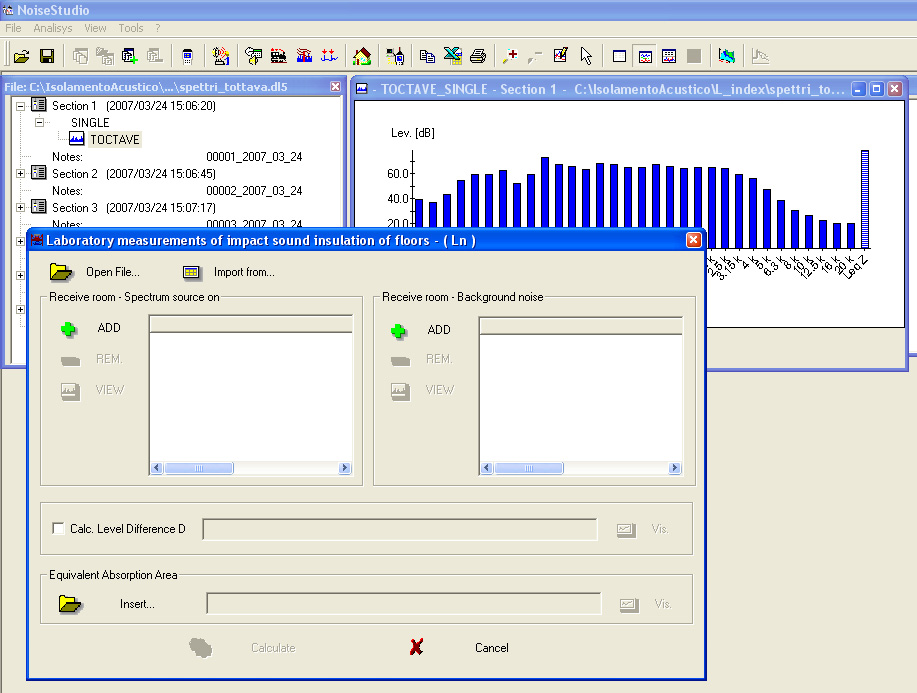
To add the just opened file's data, press |
Repeat the same steps to add the measurements of the receiving room background noise spectrum only.
| To remove an already added file, select it using the mouse and press |
| To view an already added file, select it using the mouse and press |
Enter:
a reference level Lref to calculate the sound level pressure reduction D,
a receiving room equivalent absorption area.
To proceed with the coefficient calculation, press Calculate.
The application shows the Ln and DL index trends, if selected, as a table or graphically, and the receiving room average reverberation time (or equivalent absorption area) is only shown as a table.
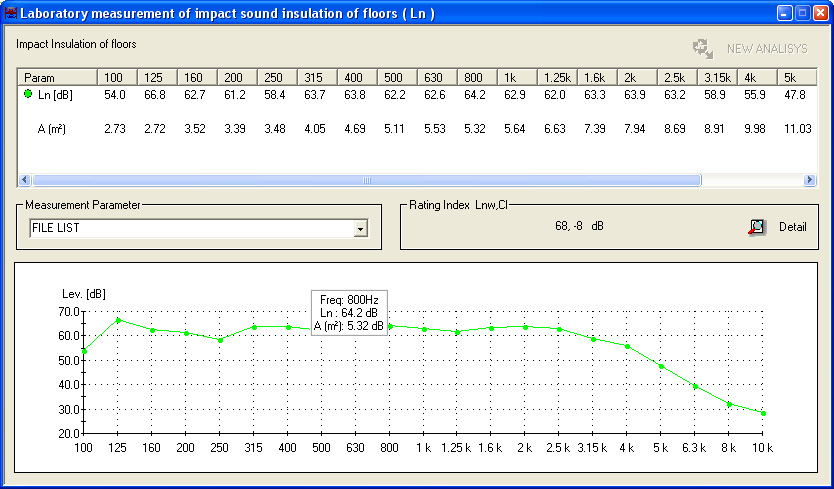
The FILE LIST is the list of files on which the average has been calculated. Selecting a file from the list, it will be shown automatically.
Pressing the ![]() key, the same index as a function of frequency is shown.
key, the same index as a function of frequency is shown.
The results gotten can be
saved (File >> Save as...), |
|
exported to Excel (File >> Export to Excel), |
|
copied to clipboard (Tool >> Copy to Clipboard) or |
|
printed (File >> Print). |
By pressing the "NEW ANALYSIS" key, you can reactivate the analysis window with all files used to obtain that result. |
ISO REPORT
By selecting the "Analisys >> Acoustic Insulation >> Create Report" menu item, you can generate an ISO report into an Excel spreadsheet.
The standardized impact-sound pressure levels L'n and L'nT define on site the ceiling sound reduction capacity.
The calculation is carried out by comparing the receiving room average sound spectrum (after considering background noise effects) when the impact-noise machine is operating in the source room. The receiving room average reverberation time (will give L'nT) or equivalent absorption area (will give L'n) can be used as calculation correction factor.
Please see the description of the measurement here.
Procedure
Download the data files into a PC folder.
Select the menu item Analisys >> Acoustic Insulation >> Start Analisys.
In the window that opens, select the Impact noise insulation on site (L'n - L'nT) measurement and click OK to confirm.
The program will ask if you wish to create a project or open an existing one.
This opens the Impact noise insulation on site (L'n - L'nT) main window.
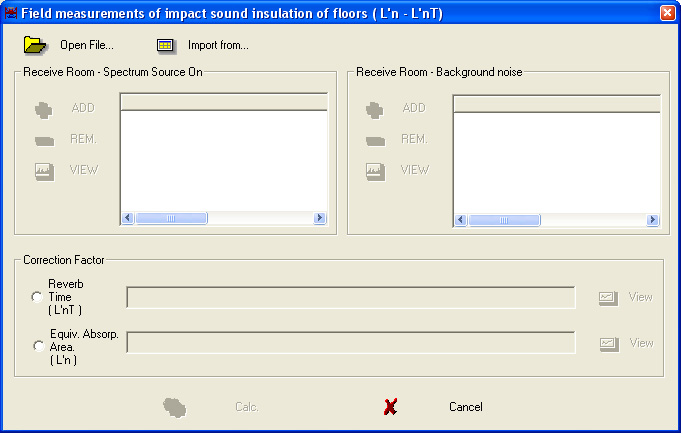
The window is divided into four sections:
Receiving room spectrum describes the signal average spectrum measured in the receiving room.
Receiving room noise describes the background noise spectrum measured in the receiving room in absence of the signal.
Correction factor collects the data for the receiving room average reverberation time (the standardized impact-sound pressure level coefficient L'nT is calculated) or equivalent absorption area (the standardized impact-sound pressure level coefficient L'n is calculated).
Pressing Open File, opens the data files (dl5 extension) concerning the previously acquired and saved on PC receiving room spectrum measurements.
Once opened, each file appears in the application main page, as in the following example:
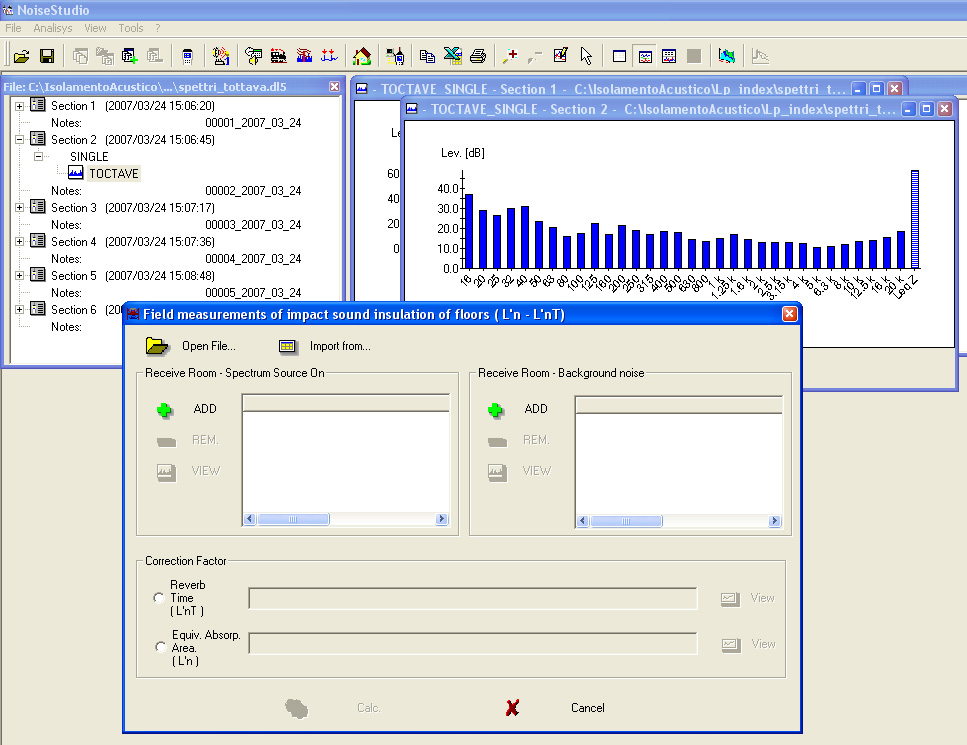
To add the just opened file's data, press |
Repeat the same steps to add the measurements of the receiving room background noise spectrum only.
| To remove an already added file, select it using the mouse and press |
| To view an already added file, select it using the mouse and press |
Enter the receiving room reverberation time (to calculate the L'nT coefficient) or equivalent absorption area (to calculate the L'n coefficient).
To proceed with the coefficient calculation, press Calculate.
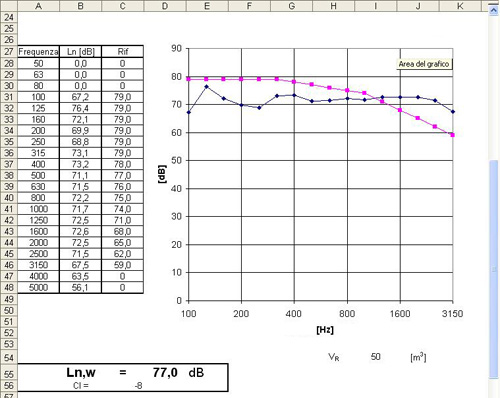
The application shows the L'n or L'nT index trend, as a table or graphically, and the receiving room average reverberation time (or equivalent absorption area) is only shown as a table.
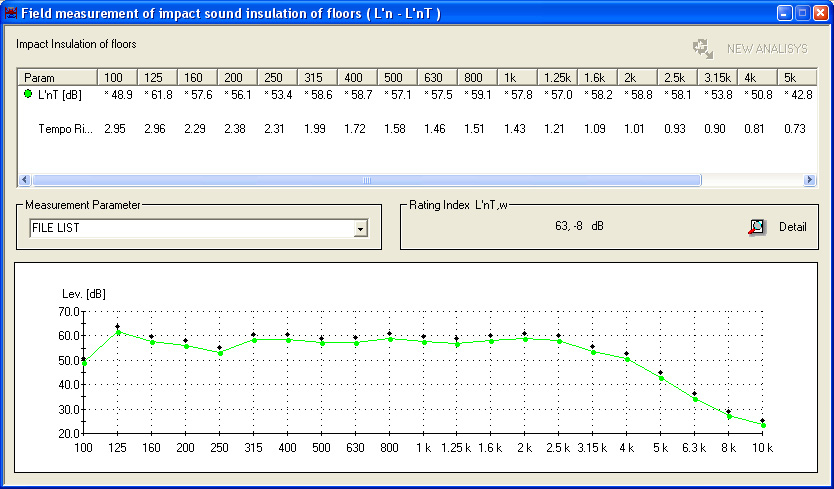
The FILE LIST is the list of files on which the average has been calculated. Selecting a file from the list, it will be shown automatically.
Pressing the ![]() key, the same index as a function of frequency is shown.
key, the same index as a function of frequency is shown.
The results gotten can be
saved (File >> Save as...), |
|
exported to Excel (File >> Export to Excel), |
|
copied to clipboard (Tool >> Copy to Clipboard) or |
|
printed (File >> Print). |
| By pressing the "NEW ANALYSIS" key, you can reactivate the analysis window with all files used to obtain that result. |
ISO REPORT
By selecting the "Analisys >> Acoustic Insulation >> Create Report" menu item, you can generate an ISO report into an Excel spreadsheet.
The various indices calculated by NoiseStudio R, R', DnT, Rtheta, D2m,nT, Ln, L'n, L'nT are dependent on frequency.
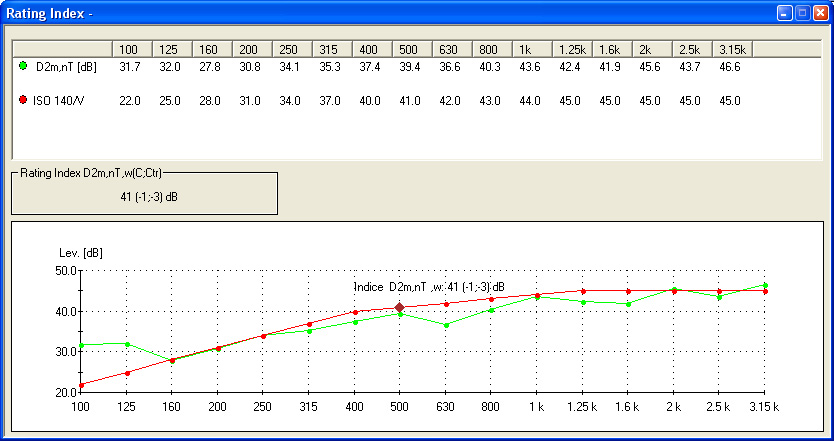
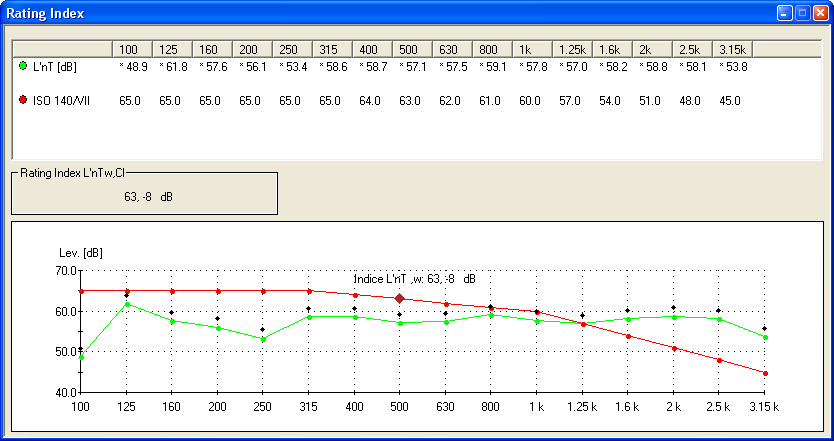
To obtain data independent from the frequency, the evaluation index has been introduced. This index is obtained by superimposing the subject-matter parameter curve on a reference curve described by ISO 717-1 for wall sound insulation and for ceilings by ISO 717-2.
NoiseStudio automatically performs the calculation by clicking ![]()
in the summary window of each index calculation.
The following window appears on pressing this button:
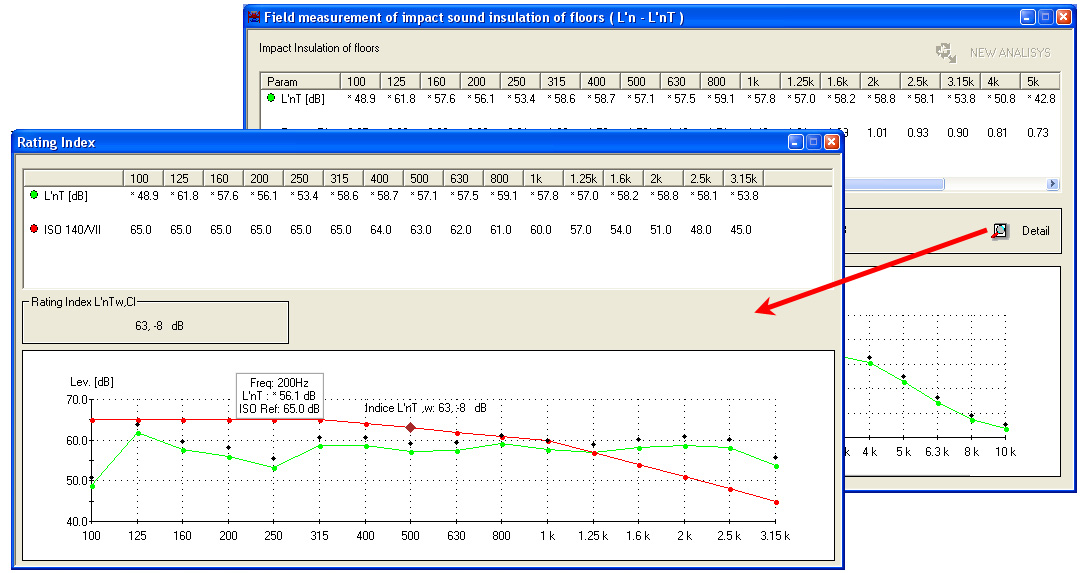
It shows:
the examined parameter trend and the ISO reference curve are presented as a table or graphically
the evaluation index
The results gotten can be
exported to Excel (File >> Export to Excel), |
|
copied to clipboard (Tool >> Copy to Clipboard) or |
|
printed (File >> Print). |
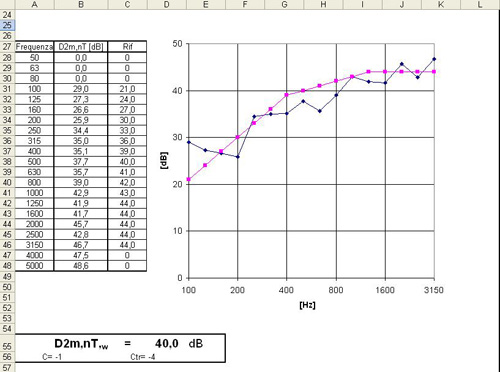
The data displayed as a table can be automatically exported to an Excel spreadsheet by pressing the Export in Excel button.
![]()
In multiple sessions, you can choose to export either only the current spectrum or the set of spectra making up the session:
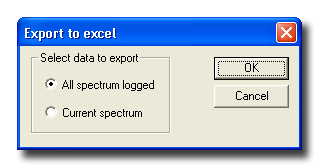
Together with the data, a page with the instrument' s parameters is exported.
The upper part of the page contains the main menu from which all functions offered by the NoiseStudio application can be accessed.
All that is necessary to activate a function is opening the drop-down menu where the function is located and selecting it with the mouse. According to the context, some menu items are disabled as the function performed is not active. These items are reported in grey.
Open
Opens a saved file. The files managed by the application have the following
extensions:
.dl5 (file deltalog5)
.rev (average reverberation time)
.eaa (equivalent absorption area)
.Saf (acoustic absorption index)
.Rif (sound reduction index R)
.RpD (the apparent sound reduction index R' or standardized difference of DnT levels)
.Rfi (façade insulation index)
.Lif (standardized pressure level)
Save as…
If the current file is a measurement file (dl5 extension), the command
opens the following window for the file to be saved.
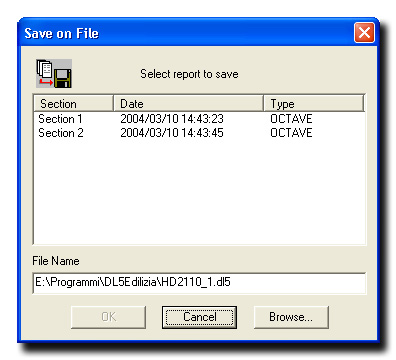
The sections that make up the set of data are listed in the main window. It is possible to select them all, or only some of the sections to be saved: to select a consecutive group of sections, click on the first one and then, holding down the Shift button, click on the last one.
To select a non consecutive group of sections, click on each
one while holding the Ctrl button down.
The Browse button can be used to modify the position of the file, or
the complete path can be typed in the File Name line.
The File Name window shows the name and the position of the file.
Note: The OK button is not activated until at least one page has been selected for saving.
If the file to be saved is not a data file, the normal "save as" window is opened.
Automatic save each minute
It enables an automatic save each minute of the Machines and
Workers file (only for the Worker Protection Module)
Close
Closes the selected file.
Close All
Closes all open files.
New Workspace
NoiseStudio can contemporarily manage different types of files within
a Workspace.
The New Workspace menu item creates a new Workspace.
Once the new Workspace is created, the application appears as follows, and measurements can be started.
Open Workspace
Opens an existing Workspace.
The files of the different measurements are reported in the Workspace window: double-clicking on the name opens the data file.
The application can open up to 32 windows per measurement type.
Close Workspace
Closes the current Workspace.
Add to Workspace
Allows adding a file of a performed measurement to the current
Workspace.
Remove from Workspace
Removes the selected file from the Workspace.
Export in Excel
Opens Microsoft Excel and exports the currently active data into an Excel
folder. The Microsoft Excel application must be installed on the PC in
order for this feature to be enabled. Up to 30000 samples per time are
exported: for higher quantities you are prompted for the data block to
be exported.
See also the paragraph Exporting Data.
Print
It prints the current file. The data displayed in the main page (data table
or graph) are printed.
Printer Setup...
Opens the dialog box in which the printer options can be set.
Exit
Closes the application.
The submenu contains the function:
WORKER PROTECTION
It enables the windows to perform the analysis of the noise exposition
in the working environment, from the measurements performed
ACOUSTIC POLLUTION
>> Daily Climate
>> Weekly Climate
>> Yearly Climate
It enables the Acoustical Climate window for the analysis
of acoustical climate.
ACOUSTIC POLLUTION >> Railways-Airport
Traffic
It enables the windows for the analysis of the noise made
by railways or airport traffic.s
ACOUSTIC POLLUTION >> Tone Research
It enables the windows for the tone research.
ACOUSTIC POLLUTION >> Impulse Research
It enables the windows for the impulse research.
ACOUSTIC INSULATION
It enables the windows for the analysis of sound insulation
Start Analysis
Begins the analysis phase.Create Report
Creates a report into an excel spreadsheet, user configurable according to ISO norms.Report Settings
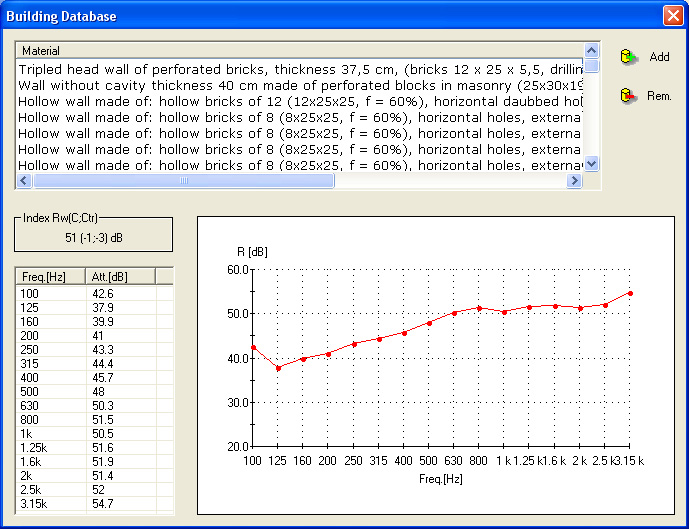
Creates a report into an excel spreadsheet, user configurable according to ISO norms.Walls Database - Floors Database
Collection of standardized characteristic walls and floors with sound reduction index Rw and frequency attenuation as a graph or table.These database can be used as a reference in order to locate the characteristics of a wall or floor with certain acoustic characteristics, or as a comparison element with the response given by a tested wall or floor (please see the comparison function details here).
The Add key is used to add new items to the list.
In the window that opens, input the wall or ceiling attenuation characteristics, the C and Ctr coefficients and a name to identify the new element in the database.The Rem key removes the selected item from the database.
The opened database item can be:
exported to Excel (File >> Export to Excel),
copied to clipboard (Tool >> Copy to Clipboard) or
printed (File >> Print).
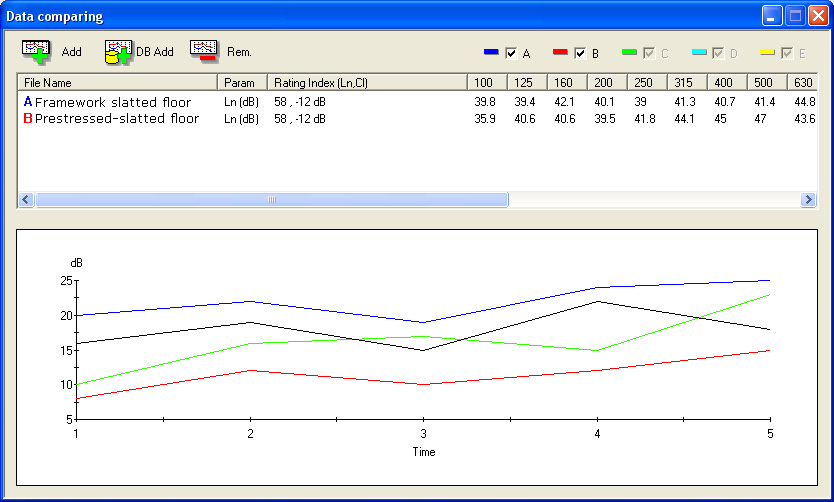
This function allows comparing up to five evaluation indices curves.
The curves can be input using the Add key, getting the data from already saved files or imported from the database using the Add DB key.
To remove a curve, select it and press Rem.
The data collected in the comparison window can be
exported to Excel (File >> Export to Excel),
copied to clipboard (Tool >> Copy to Clipboard) or
printed (File >> Print).
MONITOR >> Start Monitor
It opens the "monitor" module.s
Table
It displays the data of the files as a table.
Graph
It displays graphically the data of the files.
Table & Graph
It displays the data of the files as a table and graphically.
3D Graph
It displays three-dimensionally the OCTAVE, TOCTAVE and FFT types of data
of the files.
Level Map
It displays the OCTAVE, TOCTAVE and FFT types of data of the files as
a colour level map.
FFT Resolution
It allows editing of the frequency resolution for data such as Single
FFT.
You can choose among:
100 Hz resolution and from 94 to 21563 Hz interval
10 Hz resolution and from 12 to 2462 Hz interval
1 Hz resolution and from 7 to 290 Hz interval
FFT Scale
It allows editing of the amplitude scale between logarithmic
(dB) and linear (Pa).
Under-range Level
It allows showing or hiding the under-range level.
View Absolute Date-Time
It allows editing of the time scale from relative view to absolute view.
Rename Channels
Allows associating a name to the various measurement channel
(valid for HD2030 instrument)
Unit of Measurement / Scale
Allows modification of the unit of measurement and scales from
measurement channels (valid for HD2030 instrument)
Toolbar
It enables or disables the Toolbar.
Status Bar
It enables or disables the Status Bar.
Instrument Manager
Opens the command window to manage the instrument.
Compare Results
Opens the window to compare the measured attenuations
Copy to Clipboard
This command copies the current window to the Windows Clipboard
as both a graph or table and allows it to be pasted as an image in another
application.
After selecting the menu item Copy to Clipboard, open the destination
application (editor, spreadsheet, graphic application, ...) and use the
Paste command (or Paste Special if available) to paste the clipboard' s
contents.
Zoom +
Enlarges a previously selected area of the graph. By holding down the left button
of the mouse and moving the pointer over the graph you can select the area to
be enlarged. Once the area is selected, use Zoom+ (or the Apply Zoom
button), to perform the enlargement.
Zoom -
Returns to the standard display for the SLM and History Profile graphs
and opens the window for the spectra described in the previous point.
Zoom Tool
It opens the Zoom Manager window, allowing a more precise management of
the zoom.
Leq Recalc
It allows recalculation of the Leq from a trace of measured
data.
Statistics Proc.
It enables the statistics processing on the currently selected Measurements
Window.
It is available only for STAT type measurements both single and recordings.
It allows choosing among:
Probabilities
Cumulative Probability
Percentile Levels
Insert Label
It enables the management of labels, allowing insertion of new ones or
selection and editing of existing ones.
Select Curve
It allows selection of the time trace to be displayed.
Synchronize Amplitudes
It allows synchronization of the amplitude of octave and third
of octave spectra.
Filter by Amplitude
It allows filtering of the data concerning the reverberation time according
to the amplitude difference between signal and background noise.
Filter by Correl. Coeff.
It allows filtering of the data concerning the reverberation time according
to their correlation coefficient.
Reverberation Decay
It allows displaying the time trend of the measurements performed during
the reverberation time calculation.
Schroeder's Integral
It enables or disables the display of the time trend of the measurements
performed during the reverberation time calculation, acquired with the
Schroeder's Integral method.
Software Updates
It starts the program automatic update via web.
NoiseStudio Info
Information on the software version.
NoiseStudio Licence
Software license with the final user.
NoiseStudio Handbook
NoiseStudio software manuals.
Quick Guide
It opens the Quick Guide for the different installed Software Modules.
Software Activation
Visualize the current activation
status of the modules. If you did not purchase the license, the module
is supplied under DEMO condition.
Under this condition all the software functions are enabled but you
can only use the sample files as input data, which are availabe in
the CDRom NoiseStudio - Sample Files (D:\Esempi\).
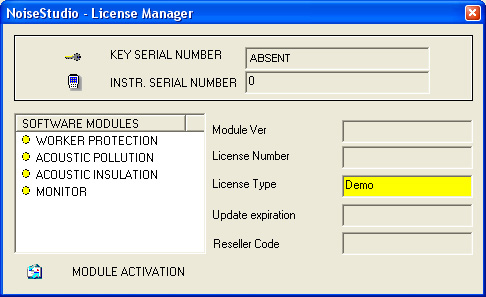
If you have the basic version of the software without modules and you wish to buy the user license for one or more modules, please contact your distributor. The software will be supplied along with the proper key already activated: in order to use the module, it is necessary that the hardware key is pluged into a USB port of the PC.
If you already have one or more activated modules with proper hardware key and you want to buy another one:
press key "Activate module",
Contact your supplier and give him the code of the module you should purchase.
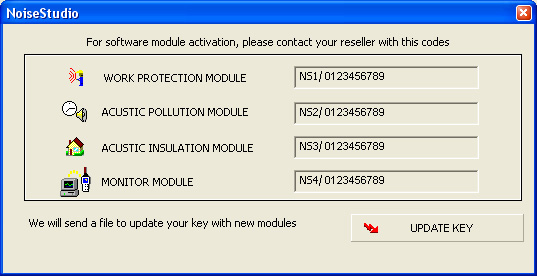
Once you have the file, plug the key into a USB port of the PC and press the key "Update key": select the file received by the supplier and confirm with OK. The hardware key will be updated with the new module.
To speed up the use of the system, some operations accessible trough the menus are also located on the command bar immediately beneath the main menu in the form of buttons.
|
|
Open File |
|
|
Save as… |
|
|
New Workspace |
|
|
Open Workspace |
|
|
Add file to Workspace |
| |
Remove file from Workspace It removes the selected file from the Workspace. |
| |
Instrument Manager |
| |
Worker protection >> Start analisys It starts the Worker protection module. |
| |
Acoustic climate >> Start analisys It starts the Acoustic climate module. |
| |
Railway/Airport Traffic >> Start analisys It starts the Railway/Airport Traffic module. |
| |
Tone research It starts the Tone research function. |
| |
Impulse research It starts the impulse research function. |
| |
Acoustic insulation >> Start analisys It starts the Acoustic insulation module. |
| |
Monitor >> Start analisys It starts the Monitor module. |
|
|
Copy to Clipboard |
|
|
Export
to Excel |
|
|
Print |
| |
Zoom+ |
|
|
Zoom- |
| |
Insert label |
|
|
View table |
| |
View graph |
| |
View table and graph |
| |
Levels map |
| |
3D graph |
|
|
? >> NoiseStudio Handbook |
Sound absorption coefficient (ISO 354)
Sound reduction index R (ISO 140 - 3)
Apparent sound reduction index - Standardized difference of levels (ISO 140 - 4)
Sound reduction index - Façade insulation (ISO 140 - 5)
Laboratory impact-noise insulation index (ISO 140 - 6 ISO 140 - 8)
On site impact-noise insulation index (ISO 140 - 7)
Delta Ohm Srl will not be liable for any direct or indirect damage arising out of use of this software.
Delta Ohm Srl will provide updated information for the software, but does not guarantee its completeness and reserves the right to change the software contents and legal notes in any moment without prior notice.